(The above image is created by Nandan Desai)
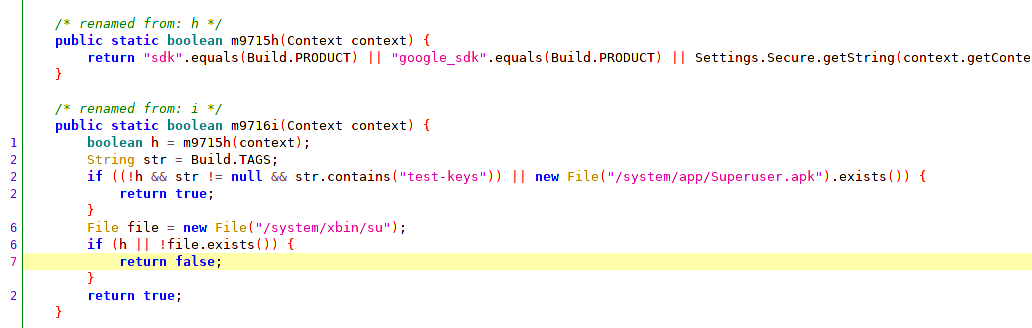
In modern operating systems, applications always reference memory using virtual memory addresses. The above diagram illustrates what a Virtual Memory is! Virtual Memory is just a layer on top of RAM and some small portion of hard disk (known as pagefile or swap). Applications are only aware of the Virtual Memory and are not aware of the pagefile or the physical memory.
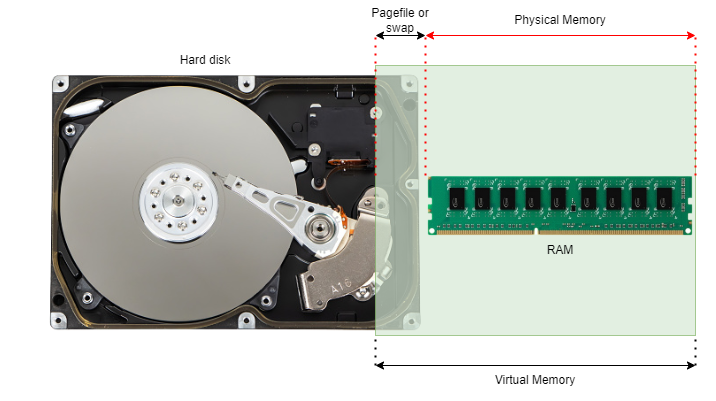
This Virtual Memory is divided into two parts.
- User-mode virtual address space ("user space")
- Kernel-mode virtual address space ("kernel space")
(The above image is created by Nandan Desai)
The kernel and certain device drivers, which typically run in the privileged mode (a.k.a, kernel mode) of the processor, take up the Kernel-mode virtual address space. The rest of the processes, which typically run in user mode of the processor, take up the User-mode virtual address space.
The processes running in the kernel mode of the processor can access both user space and kernel space of the virtual memory.
Processes running in the user mode of the processor can only access the user space assigned to them.
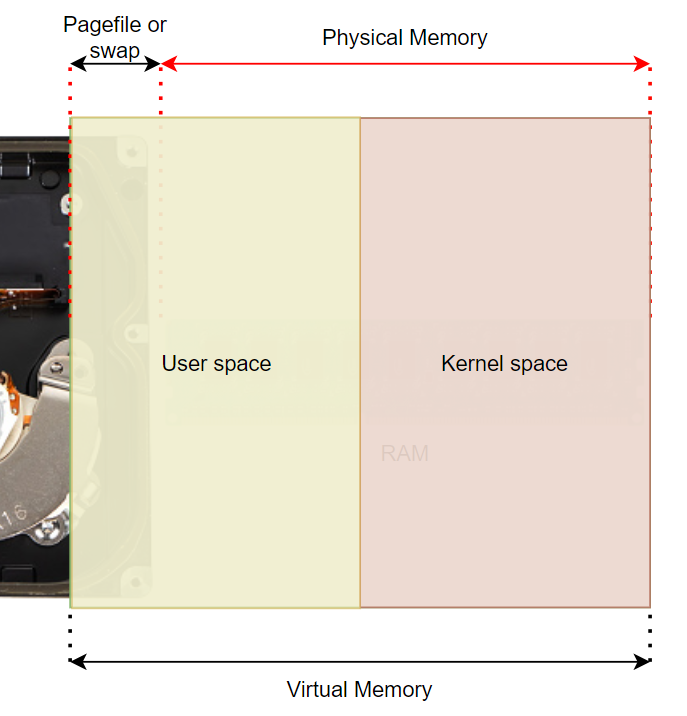
On a 32-bit Windows machine, and with default configurations, the user space is 2GB and kernel space is 2GB. Each virtual address length is 32 bits and therefore, there are a total of 2^32 virtual addresses which can address a total virtual memory of 4 GB. Usually, the first half of the virtual addresses (0x00000000 to 0x7FFFFFFF) are for user space, and the next half (0x80000000 to 0xFFFFFFFF) are for the kernel space.
A peculiar difference between user space and kernel space is, the entire user space is private for each process! That means, when a process is loaded into the virtual memory, it sees that the entire user space (i.e., the address from 0x00000000 to 0x7FFFFFFF) is free for it to use! It can take up any address from the user space and it doesn't affect the other processes! This is the illusion that the Memory Manager of the Operating System creates for every user-mode process on the system! Every process thinks that it is free to take up any of the addresses in the range 0x00000000 to 0x7FFFFFFF. And that's why, two or more processes can have the same virtual address. But the physical address will obviously differ. We'll talk about how this mapping from virtual memory to physical memory is done later!
But as for the kernel space is concerned, it's shared amongst all the kernel-mode processes. If the kernel space ranges from the address 0x80000000 to 0xFFFFFFFF (as it is for the 32-bit Windows), then two kernel mode processes cannot have the same address in that range or otherwise, they will be overwriting each other.
The following diagram illustrates this clearly:
(The above image is taken from Microsoft Docs)
On 64bit Windows, user-mode and kernel-mode virtual address space is 128 TB each!
It's that huge because the total addressable size for a 64-bit machine is 2^64 bits (~2.305 Exabytes).
That means, each user mode process can take up any address between 0x000'00000000 to 0x7FFF'FFFFFFFF.
More on this Windows memory limits here: https://docs.microsoft.com/en-us/windows/win32/memory/memory-limits-for-windows-releases#memory-and-address-space-limits
Now, of course the user-mode or kernel-mode processes cannot consume 128 TB of memory because of hardware limitations. But the Memory Manager creates this illusion for the processes that they can use that much amount of memory addresses. That's why the memory that the processes see is called a Virtual Memory. Because it's not real!
So, to conclude, here is an illustration of how Notepad.exe and MyApp.exe's virtual memory layout may look like and how they are mapped to the Physical memory (and notice the virtual addresses and physical addresses of the two processes).
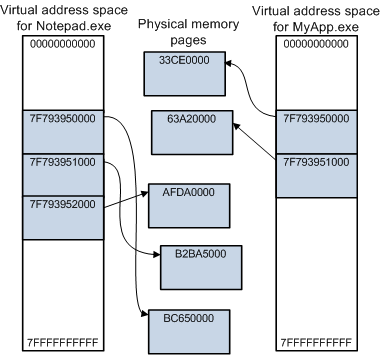
(The above image is taken from Microsoft Docs)
Memory Management Internals
Today's modern systems use Paged Memory Management technique to manage the physical memory efficiently.
The physical memory is divided into contiguous blocks of fixed length called frames. And the virtual memory is divided into a contiguous blocks (of the same size as frames) called pages. Usually, pages and frames are 4KB in size. This size depends on the instruction set architecture and the processor type. The operating system selects one or more sizes from the page sizes supported by the architecture. The page sizes can vary from 4KB to sometimes 2MB or 4MB or even 1GB!
When a program is executed, it is loaded into the virtual memory (and has it's own virtual address space if it's a user-mode process, as explained earlier). As the program grabs pages of the virtual memory, these pages are mapped to the frames of the physical memory. This mapping is done by the Memory Manager of the Operating System.
The ultimate goal of a Memory Manager is to satisfy the memory requirements of all the processes running on the system. It does this by constantly moving frames from physical memory to the pagefile (on the disk) and vice versa. The processes are not aware of this and are in the illusion that they are just using pages of "memory" as required but behind the scenes, the Memory Manager keeps hustling and gives an impression to the processes that they are using the lightning-fast memory but, in reality, they might just have some of their pages residing on the disk! The moving of frames from physical memory to the pagefile is called Memory Paging or Swapping. Each Operating System (whether it's Windows or Linux or any other OS) has it's own algorithm of how the Memory Manager is implemented. But the overall concept of Memory Management remains the same across Operating Systems.
Page Table
The Memory Manager maintains a table where it stores the mapping-related data of pages and frames. This table is called as a Page table and each of the mapping entry in that table is called a Page Table Entry (PTE). Page table resides separately on the Physical Memory and the table content is directly managed by the Memory Manager of the OS.
Virtual address translation
Even the processor of the system sees the virtual address when it's executing an instruction of a process. If a process wants to read/write data on the "memory", the process specifies that to the processor through an instruction and the virtual address where that data has to be read/written.
When the processor goes to execute that instruction and tries to visit that virtual address, there is a special hardware component called Memory Management Unit (MMU) which intercepts this virtual address on-the-fly and replaces it with corresponding the physical address!
MMU refers to the Page table in the memory to do this virtual address translation. Remember that this Page table was created and is maintained by the Memory Manager of the Operating System. MMU only refers that page table to do the virtual address translation for the processor.
As the MMU has to go through the Page table every time it has to do the virtual address translation, there is another hardware component within the MMU called Translation Lookaside Buffer (TLB) which helps in speeding up this translation process.
TLB is just a small memory cache to store a few previously translated virtual address and their corresponding physical addresses. This cache is present only to speed up the translation process in the MMU.
So, here is how the entire virtual address translation process flows:
- When a virtual address needs to be translated to a physical address, TLB is searched first.
- If a match is found, which is known as a TLB hit, the physical address is returned and memory access can continue.
- However, if there is no match, which is called a TLB miss, the MMU (or, in certain implementations, the operating system's TLB miss handler) will typically look up the address mapping in the page table to see whether a mapping exists, which is called a page walk.
- If a mapping exists in the page table, it is written back to the TLB, and the faulting instruction is restarted. And now the MMU will obviously find the mapping in TLB and the process carries on normally.
- If a mapping exists in the page table, but the Page Table Entry (PTE) is marked as "moved out" (i.e., the frame corresponding to the page has been moved out of the physical memory and to the disk), then the MMU raises a Page fault exception. This page fault exception will be handled by the Memory Manager of the Operating system. The Memory Manager needs to bring back that frame to the Physical memory, update the Page table, and then restart the instruction that had a Page fault.
- If the mapping does not exist in the Page table, then the MMU will call the Operating System to handle this case. The OS will send a Segmentation Fault signal to the offending program which usually leads to a program crash.
Page table implementations differ on different systems. Some systems used to maintain a single global Page table while some others maintain a Page table for each process. There are also some implementations where the Page tables are stored in Virtual Memory. That means, the Page tables need to be paged themselves. And we also have hierarchical page tables. The complexities increase as we go deeper into the implementation details of various systems. But the concept of memory management described in these notes remains the same.
It's important to note that the Paging needs to be enabled by the kernel during the system boot process. On Intel processors, Paging is enabled by setting the PG flag of a control register named cr0. When PG = 0, virtual addresses are interpreted as physical addresses.
The Memory Manager initializes the Page Table in the Physical memory and then enables Paging by setting the PG flag of cr0 control register. From that point onwards, MMU starts considering all addresses as virtual addresses and does the translation as described previously.
Direct Memory Access (DMA)
There are certain peripherals (such as Thunderbolt ports) on some PCs that allow the devices to access the Physical memory directly. The data from these devices doesn't flow through the CPU. And the MMU doesn't touch these DMA instructions. DMA devices can directly work with the Physical memory to speed up the data transfer. But how much or what part of Physical memory is allowed to be accessed by such devices depends on the system architecture. This direct access to the Physical memory is called Direct Memory Access (DMA). There were/are certain vulnerabilities in DMA and are exploited by the attackers to bypass OS security checks and gain access to part or whole of the Physical Memory and steal data or install a malware on the Physical memory. Such attacks are called "DMA attacks".
References:
https://static.lwn.net/images/pdf/LDD3/ch15.pdf
https://doc.lagout.org/operating%20system%20/linux/Understanding%20Linux%20Kernel.pdf
https://tldp.org/LDP/tlk/mm/memory.html
https://www.kernel.org/doc/html/latest/admin-guide/mm/concepts.html
https://en.wikipedia.org/wiki/Memory_management_unit
https://techcommunity.microsoft.com/t5/ask-the-performance-team/memory-management-101/ba-p/372316
https://www.cs.cornell.edu/courses/cs4410/2015su/lectures/lec14-pagetables.html