Saturday, April 29, 2023

Some 'Networking' course paper reviews

Paper review of THE DESIGN PHILOSOPHY OF THE DARPA INTERNET PROTOCOLS by David D. Clark

Summary
This paper constructs the reasoning behind why the protocols are designed the way they are by outlining the original objectives of the Internet architecture.

Important Points

  • The paper mentions that, since the Internet was designed to operate in a military context[1], the survivability of a connection was given the top priority. That is, the Internet communication must continue despite the loss of intermediate networks or gateways. And the internet would have shaped differently if it was designed in a commercial context, in which case, things like cost effectiveness and accountability would have been a top priority.
  • Packet Switching was selected instead of Circuit Switching[2] because the applications that were required to be supported at the time, like remote login, were being served by the packet switching paradigm and the networks that were being interconnected were also packet switching networks. Hence, Packet Switching was accepted as a fundamental component of the Internet architecture.
  • The internet architecture is fundamentally based on Datagrams[3]. That means, the state of the packets are not stored in the intermediate routers after they’re forwarded. It is up to the hosts to maintain the state of the connection and maintain reliability and hence the TCP was designed that way. And the need to support multiple transport layer protocols was the reason for the separation of TCP and IP layers and the use of Datagrams allowed this separation. This also allowed the development of UDP, which was created to provide an application-level interface to the basic datagram service of the Internet[4].

Comments
  • This paper gives a nice overview of the history of how the protocols evolved. The author of this paper also rightly predicted that internet protocols would evolve to incorporate effective resource usage as the early design decisions were made by focusing more on the survivability of the connections rather than resource usage and cost effectiveness.
  • This paper helped me understand that TCP was designed first before UDP. I was under the impression that UDP was developed first. The author also explained why UDP was developed and why reliable communication can sometimes be detrimental (like causing more delay when a real-time communication is needed). 


Paper review of End-To-End Arguments in System Design
Authors of the paper: J. H. SALTZER, D. P. REED, and D. D. CLARK


Summary
The end-to-end argument principle[1] says that the application-specific network features should be implemented at the ends (hosts) of the network rather than within the network.

Important Points

  • This paper articulates the end-to-end argument principle, which says that application-specific features, like error detection, detection of duplicate messages, sequential ordering of messages, encryption, etc. need to be implemented on the hosts of the network rather than in the gateways.
  • The authors also argue that certain features, like error detection, can be implemented by both the hosts running the applications and the gateways that deal with network packets of those applications. And this argument is mainly focused on the performance of the network and not on reliability (as one would assume). The authors give an example of a file transfer application to make their point. If there is no error detection mechanism within the gateways of the network, then, in case of failures, the entire file needs to be transferred from scratch, which is a major performance degradation.
  • The paper concludes by saying that this end-to-end argument principle can help better organize the protocol layering of the network. Since this paper was published around 1984, the protocol layers (like TCP/IP) weren’t standardized yet (they were standardized with the publication of RFC 1122 in 1989[2]). Hence, this paper contributed to determining which features (like error detection, encryption etc.) of the communication on the internet need to be placed in which layer of TCP/IP.


Comments

  • The ‘Abstract’ and the ‘Introduction’ section of the paper seemed very confusing to me. They didn’t introduce what exactly is the ‘end-to-end argument’. The concept of what the paper is about became much more clear as I read along and referred to Wikipedia about this concept.
  • This paper helped me understand how and why the reasoning was made to place certain network communication features on the hosts and certain features on the gateways. Things that seem obvious now, needed a lot of reasoning back then and this paper set a tone for that reasoning during that time.


Friday, June 17, 2022

My notes on Cookies and CORS

Cookies

(This section assumes that you have a basic knowledge of what Cookies are. For proper introduction and more details about cookies, please read the Mozilla Developer Docs: https://developer.mozilla.org/en-US/docs/Web/HTTP/Cookies. The flowcharts in this section are created by Nandan Desai)

Cookies are created on the client side when either the server responds with Set-Cookie header or when the cookies are set using Document.cookie in JavaScript.

And the browser sends the Cookies to the server on the next request using the Cookie header.

Understanding the intricacies of cookies boils down to understanding various cookie attributes.

Cookie attributes can be classified into two main categories:

  1. The attributes that restrict access to cookies (like Secure and HttpOnly)
  2. The attributes that define where the cookies are sent (like SameSite, Domain and Path)

'Secure' and 'HttpOnly'

Cookies that have Secure attribute set are only sent to the server on an encrypted (HTTPS) network. Also, sites with http:// in their URL can't set Secure attribute on cookies.

Cookies that have HttpOnly attribute set are not accessible via JavaScript and are sent to the server by the browser automatically when all the proper conditions are met.

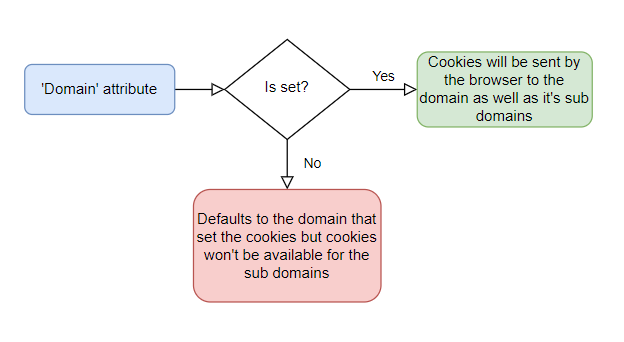
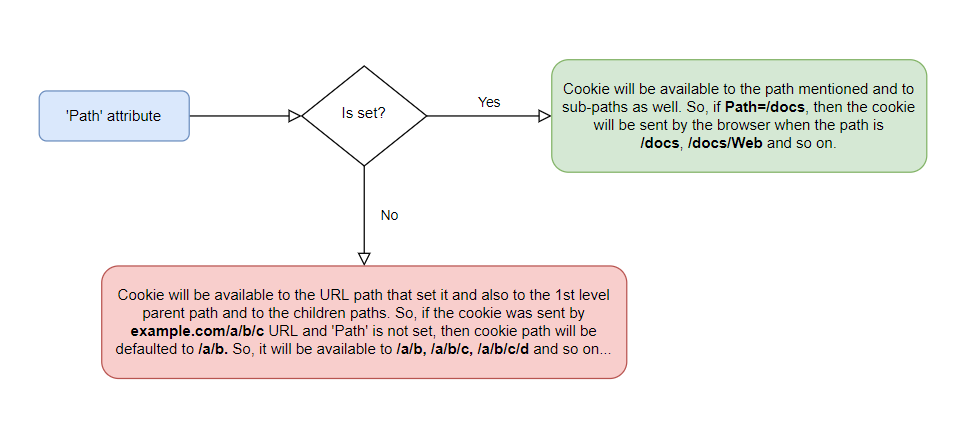
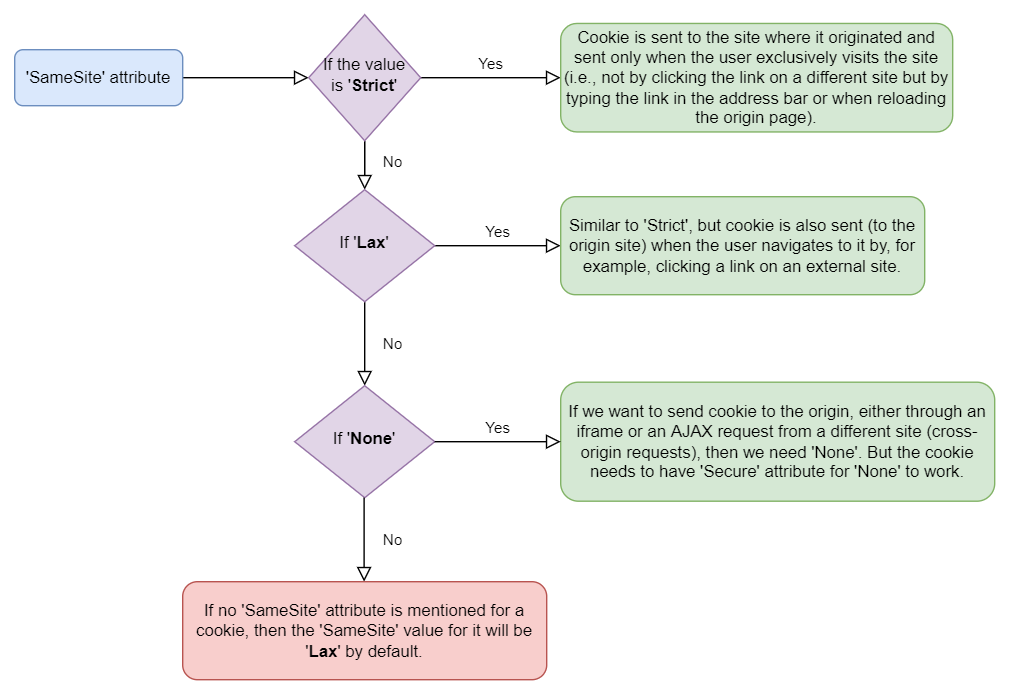
'Domain', 'Path' and 'SameSite'

  • 'Domain' attribute

domain cookie attribute

  • 'Path' attribute

path cookie attribute

  • 'SameSite' attribute

Here, the "site" refers to the domain combined with the scheme (http or https). For example, http://example.com and https://example.com are different sites according to this definition.

samesite attribute

CORS (Cross-Origin Resource Sharing)

(Most of the CORS-related content presented here is either a direct copy-paste of Mozilla Developer Docs or I've made some minor modifications to make certain things simpler to understand. You can get more details on this topic here: https://developer.mozilla.org/en-US/docs/Web/HTTP/CORS)

In simple words, CORS is a communication between the server and the browser about what the browser is allowed to do when it receives some content from the server. It's like the server is doing Access Control on the browser.

Suppose web content at https://foo.example wishes to invoke content on domain https://bar.other. Code of this sort might be used in JavaScript deployed on foo.example:

const xhr = new XMLHttpRequest();
const url = 'https://bar.other/resources/public-data/';

xhr.open('GET', url);
xhr.onreadystatechange = someHandler;
xhr.send();

This operation performs a simple exchange between the client and the server, using CORS headers to handle the privileges:


Let's look at what the browser will send to the server in this case:

GET /resources/public-data/ HTTP/1.1
Host: bar.other
User-Agent: Mozilla/5.0 (Macintosh; Intel Mac OS X 10.14; rv:71.0) Gecko/20100101 Firefox/71.0
Accept: text/html,application/xhtml+xml,application/xml;q=0.9,*/*;q=0.8
Accept-Language: en-us,en;q=0.5
Accept-Encoding: gzip,deflate
Connection: keep-alive
Origin: https://foo.example

The request header of note is Origin, which shows that the invocation is coming from https://foo.example.

Now let's see how the server responds:

HTTP/1.1 200 OK
Date: Mon, 01 Dec 2008 00:23:53 GMT
Server: Apache/2
Access-Control-Allow-Origin: *
Keep-Alive: timeout=2, max=100
Connection: Keep-Alive
Transfer-Encoding: chunked
Content-Type: application/xml

[…XML Data…]

In response, the server returns a Access-Control-Allow-Origin header with Access-Control-Allow-Origin: *, which means that the resource can be accessed by any origin.

This pattern of the Origin and Access-Control-Allow-Origin headers is the simplest use of the access control protocol. If the resource owners at https://bar.other wished to restrict access to the resource to requests only from https://foo.example, (i.e no domain other than https://foo.example can access the resource in a cross-origin manner) they would send:

Access-Control-Allow-Origin: https://foo.example

CORS effect on Cookies

The most interesting capability exposed by both XMLHttpRequest and CORS is the ability to make "credentialed" requests that are aware of Cookies and HTTP Authentication information. By default, in cross-origin XMLHttpRequest invocations, browsers will not send credentials (i.e., cookies). A specific flag has to be set on the XMLHttpRequest object when it is invoked.

Consider the following example:

const invocation = new XMLHttpRequest();
const url = 'https://bar.other/resources/credentialed-content/';

function callOtherDomain() {
  if (invocation) {
    invocation.open('GET', url, true);
    invocation.withCredentials = true;
    invocation.onreadystatechange = handler;
    invocation.send();
  }
}

If we want to send Cookies to the server then withCredentials = true needs to set on the XMLHttpRequest instance. And if the server responds with some cookie, then the server also needs to include Access-Control-Allow-Credentials: true header along with Access-Control-Allow-Origin not being a wildcard (i.e., it shouldn't be "*"). Only then, the response and the response cookies will be made available to the JavaScript code. Otherwise, a CORS error will be printed on the devtools console.

The following example explains it:


Here is a sample exchange between client and server:

GET /resources/credentialed-content/ HTTP/1.1
Host: bar.other
User-Agent: Mozilla/5.0 (Macintosh; Intel Mac OS X 10.14; rv:71.0) Gecko/20100101 Firefox/71.0
Accept: text/html,application/xhtml+xml,application/xml;q=0.9,*/*;q=0.8
Accept-Language: en-us,en;q=0.5
Accept-Encoding: gzip,deflate
Connection: keep-alive
Referer: https://foo.example/examples/credential.html
Origin: https://foo.example
Cookie: pageAccess=2
HTTP/1.1 200 OK
Date: Mon, 01 Dec 2008 01:34:52 GMT
Server: Apache/2
Access-Control-Allow-Origin: https://foo.example
Access-Control-Allow-Credentials: true
Cache-Control: no-cache
Pragma: no-cache
Set-Cookie: pageAccess=3; expires=Wed, 31-Dec-2008 01:34:53 GMT
Vary: Accept-Encoding, Origin
Content-Encoding: gzip
Content-Length: 106
Keep-Alive: timeout=2, max=100
Connection: Keep-Alive
Content-Type: text/plain

[text/plain payload]

Although line 10 contains the Cookie destined for the content on https://bar.other, if bar.other did not respond with an Access-Control-Allow-Credentials: true (line 16), the response would be ignored and not be made available to the web content. Also notice the following: Access-Control-Allow-Origin: https://foo.example. If it was Access-Control-Allow-Origin: *, then browser would have not allowed the JavaScript to access the response or the response cookies as explained earlier.

References

https://developer.mozilla.org/en-US/docs/Web/HTTP/Cookies

https://developer.mozilla.org/en-US/docs/Web/HTTP/CORS

Monday, June 6, 2022

Introduction to Stack (of a Process/Thread in the OS)

(All the diagrams in this blogpost are created by Nandan Desai)

Stack

The operating system sets up an area in the virtual memory for the stack and loads the starting address of this empty stack into the SP, the Stack Pointer register (this is the ESP/RSP register on 32 and 64-bit Intel processors respectively.). If a process has multiple threads, then each thread is given it's own stack by the OS.

The elements are pushed onto the stack using the PUSH instruction and removed from the stack using the POP instruction. Apart from PUSH and POP, there are two more instructions that can perform actions on the stack: the CALL and RET instructions. (ENTER and LEAVE instructions also perform actions on the stack but they're out of scope for this blogpost).

The main purpose of the stack is to keep track of the control flow of the program when the programmer is using multiple procedures (i.e., functions). The control is transferred to the procedures using CALL instruction and the control is returned to the previous procedure using RET instruction. A stack is where the following data is stored: the parameters passed to a function, local variables of a function and the return information (like which address to return to when RET instruction is called).

Also, there are certain exploits that abuse this return information on the stack to let the attacker change the flow of the program. To patch this, Intel has a hardware-enforced protection called Control-flow Enforcement Technology (CET) which uses an extra stack called the "Shadow Stack" along with our regular stack. Read more about it here! Covering the Shadow Stack is out of scope for us right now.

The currently executed procedure has a memory block of it's own on the stack to store it's variables. This block is called as a stack frame. The starting address of this block is stored in BP register (called as the Stack-Base Pointer). This is the EBP/RBP register on 32 and 64-bit processors. The ending address of this block is stored in ESP register (the Stack Pointer register that we talked about earlier).

There are two very important things to know here:

  1. The responsibility of creating this memory block (the stack frame) on the stack is entirely up to the assembly programmer. The starting address of the stack will initially be set by the OS in the ESP and EBP registers. But after that, the programmer needs to decide how will they use these registers to allocate space on the stack for local variables and function parameters.
  2. The stack grows downwards in the virtual address space of the Process, i.e., it starts at a higher address and when we push something on the stack, the ESP register value is decremented and when we pop something out of the stack, the ESP register value is incremented.

With this background knowledge in mind, let's try to understand how the stack is used in our assembly code!

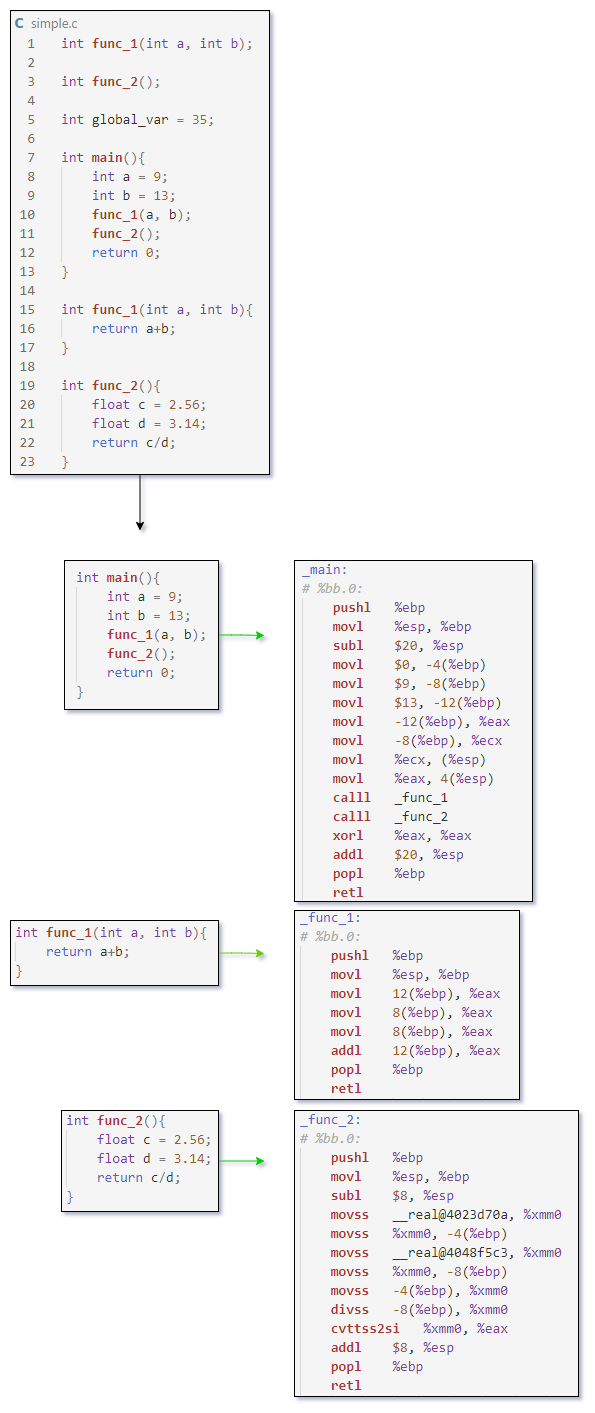
The below diagram shows a sample C program and it's assembly translation:

C to Assembly

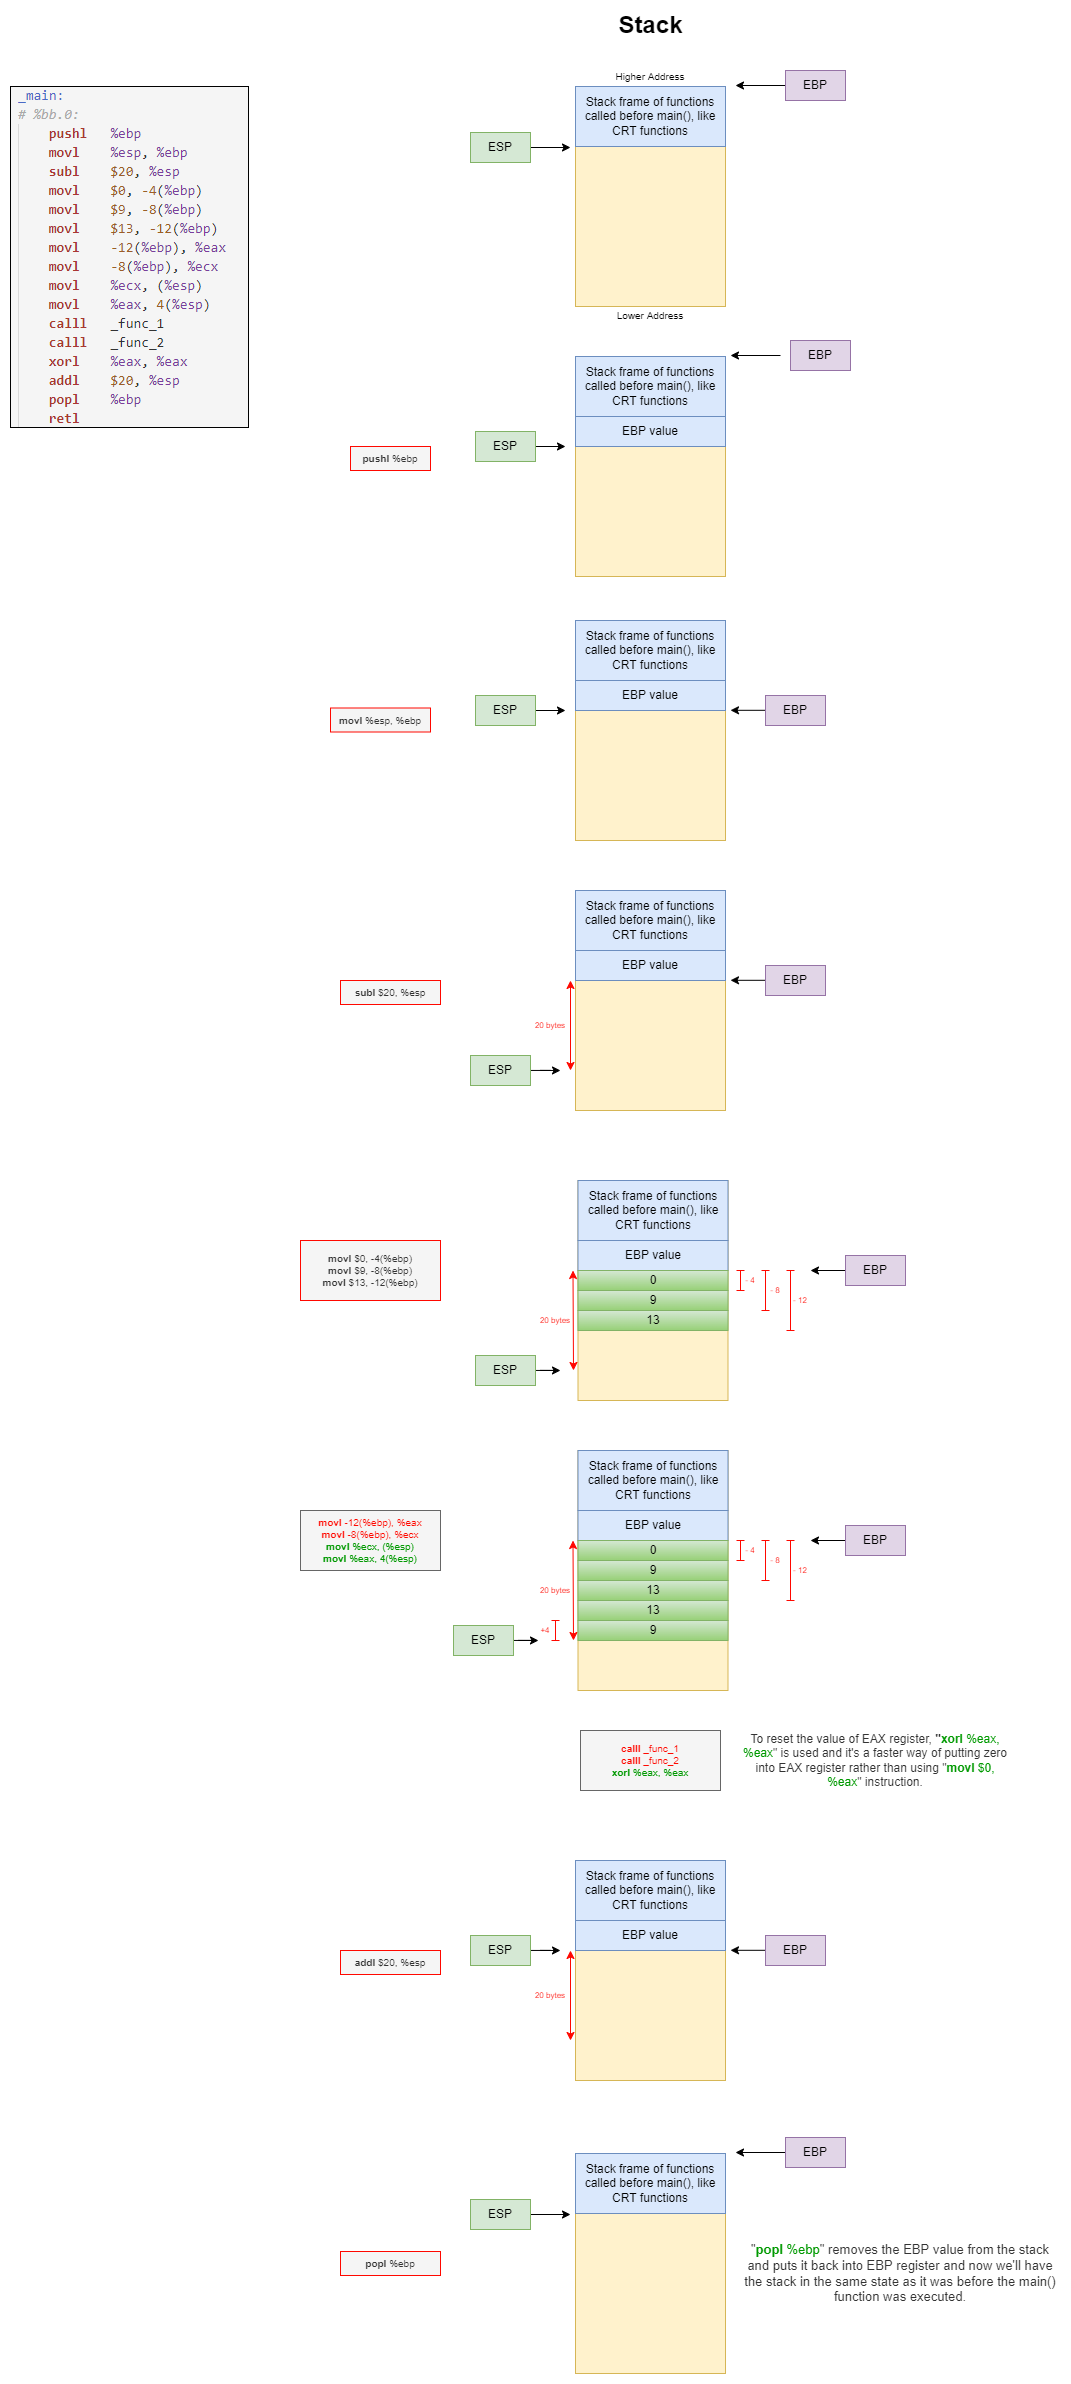
The below diagram walks you through each of the stages of how Stack changes for every instruction of the main() function shown above:

assembly stack walkthrough

(The instructions marked in red in the above diagram are either self-explanatory or will be discussed later.)

When a function is returning, it puts its final return value into the EAX register for it's previous function to access. That's the reason why xorl %eax, %eax is used in the above code as we're saying return 0; in our C program.

(I'm still not sure why we're putting 0 onto the stack. It's being pushed even if I don't use 0 anywhere in my C code. If you know, then please let me know if you know why the Assembler puts 0 onto the stack here.)

The CALL and RET Instructions

The instruction that is to be executed after the currently executing instruction, is stored in the Instruction Pointer register.

A CALL instruction will push the current value of EIP register (the Instruction Pointer) onto the stack, loads the offset or the address (this depends on the type of CALL instruction and there are many different types) in the EIP register and begins executing the procedure (function).

The RET instruction will pop the instruction pointer value from the stack and puts it into the EIP register and optionally clears the data on the stack used by the procedure which has the RET instruction.

Introduction to Processor and x86-64 Assembly

(This blogpost is created from my study notes)

Processor

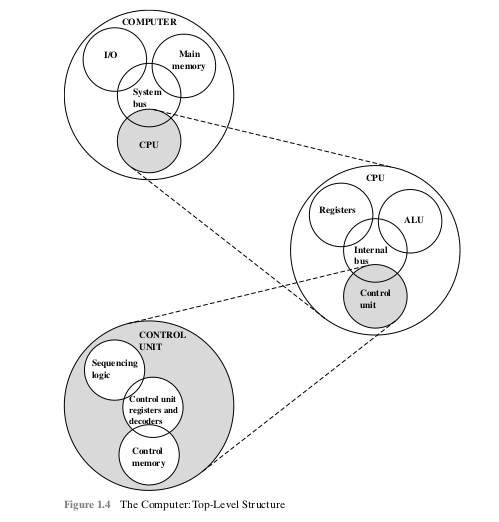
A computer broadly consists of a CPU, I/O devices, Main memory and all these communicate through a System Bus.

A CPU broadly consists of an ALU (Arithmetic Logic Unit), Registers and a Control Unit. All these communicate through an internal bus.

computer top-level structure 

(Image credit: William Stallings's Computer Organization and Architecture book)

von Neumann architecture

Most of the computers today follow the von Neumann architecture which was devised in 1940s. von Neumann architecture describes the design architecture for a digital computer as follows:

  • A processing unit that contains an arithmetic logic unit and processor registers
  • A control unit that contains an instruction register and program counter
  • Memory that stores data and instructions
  • External mass storage
  • Input and output mechanisms

von Neumann architecture is a stored-program model where the data and instructions are stored in the same memory. There are some other architectures where the program is stored but in different memory devices.

Processor

The basic function of a processor is to fetch (one at a time) a set of instructions stored in the memory and execute them.

The processor architecture that the manufacturers adopt can be categorized into two types: CISC and RISC.

CISC (Complex Instruction Set Computer)

CISC architecture is a category of processors that can do multiple tasks with a single instruction. They have complex hardware to ease the work of a compiler. For example, the ENTER instruction in x86 assembly is equivalent to the following three x86 instructions:

PUSH EBP 
MOV EBP, ESP 
SUB ESP, space_for_local_variables

(where EBP is the frame pointer and ESP is the stack pointer (which will be covered later)).

A function in x86 assembly starts with the above 3 lines and those 3 lines can be replaced by a single ENTER instruction. That's how the CISC category processors implement a complex underlying hardware to create Instruction Set intended to make the software-implementation easier.

As mentioned, one of the examples of CISC category processors are Intel x86. And x86 has more than 1000 instructions in it's Instruction Set.

x86 Instruction Listing: https://en.wikipedia.org/wiki/X86_instruction_listings

RISC (Reduced Instruction Set Computer)

Contrary to CISC, RISC was designed to make instructions execute individual functions to realize a task. The instructions are simpler and a programmer might have to provide multiple instructions to the processor to execute a task whereas, in CISC, there used to be instructions that execute multiple underlying smaller functions to execute a task and hence each instruction required more CPU cycles and thus more power-consumption. RISC architecture tries to solve these issues.

Example of RISC is the ARM architecture, MIPS etc.

Although RISC and CISC are theoretically separate, but in practice, RISC processors are growing a bit complex to meet the new technology requirements and CISC processors are becoming a bit simpler to challenge the RISC processors in the performance and energy-efficiency race. So, there is a thin line separating the RISC and CISC processors but the underlying concept that they are based upon is distinct.

Instruction Set Architecture (ISA)

The ISA specifies the syntax and semantics of the of the assembly. That means, an ISA for a processor defines the Registers, Instructions (and their syntax and semantics), Data types and Addressing Modes.

Register-memory and Load-store architectures

Most of the CISC processors have Register-memory architecture which is a type of Instruction Set Architecture (ISA). We can understand Register-memory architecture using an example. The ADD instruction in x86 can have two operands that are present either in Register or Memory.

In contrast, the Load-store architecture separates memory operation instructions and ALU instructions. That means, ADD instruction takes two operands that need to present in the Registers and not in the memory. And the data can be moved to and from the memory using separate load and store instructions. This architecture is common amongst the RISC processors.

Here we'll be learning about the ISA of x86-64 processor.

The Wikibook page gives a very comprehensive explanation on x86 Instruction Set Architecture: https://en.wikibooks.org/wiki/X86_Assembly/X86_Architecture

These notes are made by watching MIT OpenCourseWare lecture on x86-64 ISA: https://youtu.be/L1ung0wil9Y?t=808

As seen in the above article link, the AX register was a 16-bit register called Accumulator and it was used during arithmetic operations. Then, it was later on extended to 32-bit EAX ('E' stands for extended) and the 64-bit RAX ('R' stands for 'Register').

On RAX register, we can still address the lower 32-bit part of it using the alias EAX. Or, use the lower 16-bit part using AX. We can also address the higher 8-bit of that 16-bit part using AH and the lower 8-bit part using AL.

So when we write movl %al, %edx, we're asking the CPU to copy the lower 8 bits of Accumulator register into the Data register. Note that mov stands for move but it doesn't actually "move" the value but rather "copies" it. We're saying the word "copy" because the value of al register will be left behind in the Accumulator register after that instruction is complete. (Source: https://youtu.be/L1ung0wil9Y?t=1393)

x86-64 Assembly

The x86-64 Instruction is in the following format: <opcode> <operand_list>.

opcode is a short mnemonic identifying the type of instruction. operand_list has either 1, 2 or 3 operands separated by commas. Typically, one operand amongst them is the destination and the rest are the sources.

We have two different syntax to choose from when we're writing x86-64 Assembly code:

  1. AT&T syntax
  2. Intel syntax

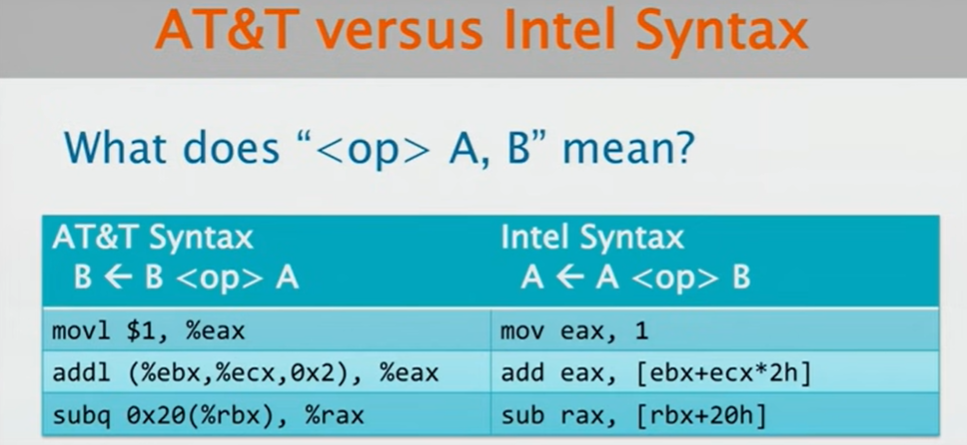
The difference between Intel and AT&T syntax can be best understood by the below screenshot:

intel and AT&T difference

The above screenshot says that when we write an instruction, say, <operation> A, B in x86-64 Assembly:

  • In AT&T syntax, the operation is done in the order: B <operation> A and the result of that operation will be stored in B.
  • In Intel syntax, the operation is done in the order: A <operation> B and the result will be stored in A.

There are also other differences showcased in the above screenshot. In this blogpost series, we'll be using AT&T syntax but we'll also try to understand the Intel syntax along the way.

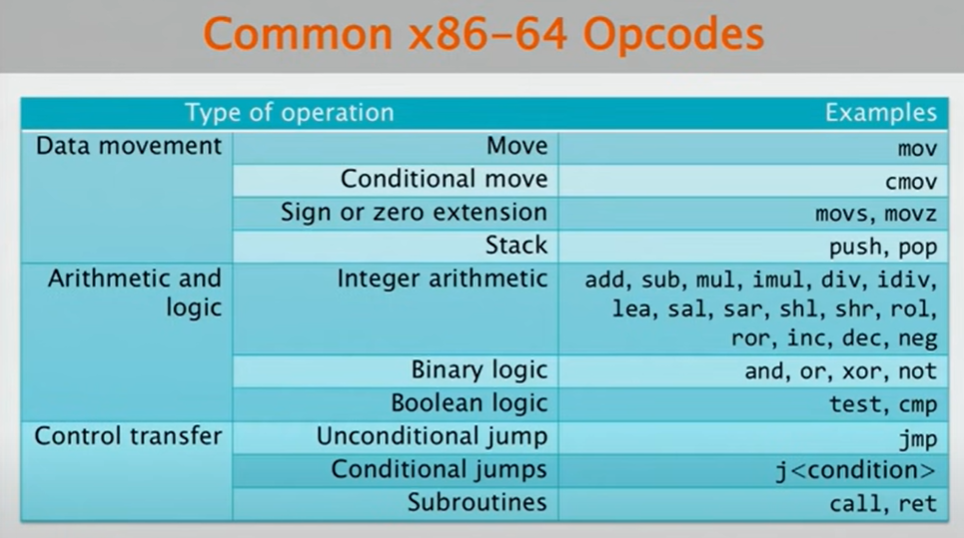
Common Opcodes

common opcodes

Data Types

For a processor, there is no distinction in the data types that are declared in high-level programming languages. Any register can hold any bytes. However, there are only two data types that need to be handled differently by the hardware: Integers and Floating Points.

The ALU of the processor only handles integers and to deal with the floating point, there is a separate hardware part in x86 processor and it's called "x87" or the "FPU" (Floating-Point Unit). It has separate registers called the "x87 stack" and extra x86 instructions called "x87 Instruction set". Although the Floating-Point hardware is integrated into the same processor, it is considered distinct due to historical reasons.

Opcode suffixes

Many instructions in AT&T syntax have a suffix (b, w, l, or q) which indicates the bitwidth of the operation (1, 2, 4, or 8 bytes, respectively). The suffix is often ignored when the bitwidth can be determined from the operands (i.e., %rax is 64-bit, %eax is 32-bit etc.). For example, if the destination register is %eax, it must be 4 bytes, if %ax it must be 2 bytes, and %al would be 1 byte. A few instructions such as movs and movz have two suffixes: the first is for the source operand, the second for the destination. For example, movzbl moves a 1-byte source value to a 4-byte destination.

When the destination is a sub-register (i.e., using %eax on %rax register), only those specific bytes in the sub-register are written with one broad exception: a 32-bit instruction zeroes the high order 32 bits of the destination register.

(Source for above explanation: https://web.stanford.edu/class/archive/cs/cs107/cs107.1222/guide/x86-64.html)

Prefixes

In AT&T syntax, registers have '%' as a prefix and constants have '$' and hexadecimal values have '0x' prefix.

Addressing Modes

There are two main types in which we can visit a memory address or a register to fetch or place a value. One way is to directly specify the memory address or the register name in our instruction, and the other way is to indirectly reference it.

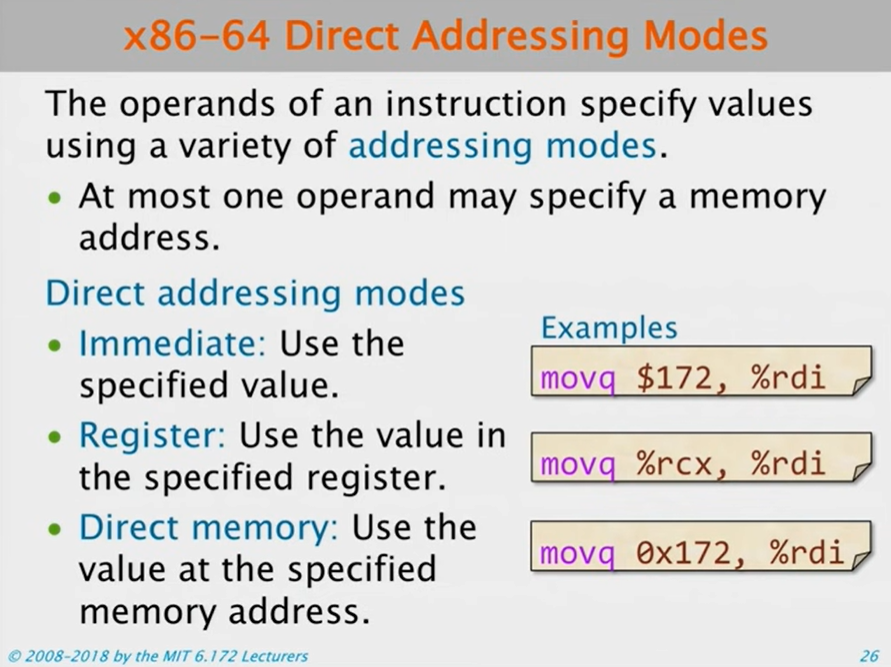
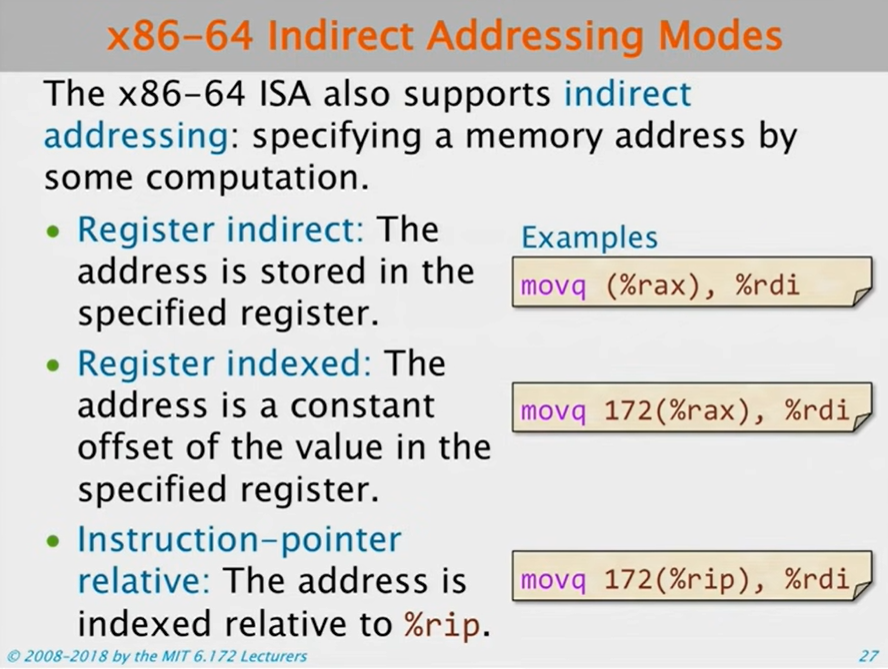
The below two slides explain this in detail:

direct addressing mode

indirect addressing mode

References

MIT OpenCourseware video lecture: https://youtu.be/L1ung0wil9Y

x86 Assembly Wikibook

I highly recommend buying one of the copies of the x86 Assembly Wikibook to understand further concepts in x86-64 Assembly. You can find the online version here: https://en.wikibooks.org/wiki/X86_Assembly

Tuesday, May 3, 2022

Windows Sysinternals Suite: "Process Monitor" tool

Process Monitor 

(I created these notes while learning about Process Monitor tool.) 


Process Monitor (or "ProcMon") is a combination of two older tools: Filemon and Regmon

Mark Russinovich wrote these old tools by doing something called as syscall hooking. Filemon and Regmon were one of the first tools written by him in the Sysinternals toolset.

ProcMon still uses some undocumented APIs in Windows and that's why it's not open source.

Introduction

Procmon helps to get to the root cause of often misleading error messages. And thus, Procmon has been proven as an indispensable troubleshooting tool.

There is a saying from David Solomon: "When in doubt, run Process Monitor".

  • Process Monitor monitors syscall activity for files and registry.
  • File and registry issues can be in the form of misleading error messages, application crashes, application hangs, silent process exits etc.
  • Procmon can help determine the root cause for missing or corrupt files, missing or corrupt registry data, permission problems and wrong DLL versions.
  • Other uses of procmon are: tuning I/O activity, understanding hard drive activity and understand file and registry usage of apps.
  • Procmon captures a ton of live event data related to files and registry. It's like wireshark but for syscall activity related to files and registry!
  • We can export the captured data and analyze it.

[The below explanation might be outdated but it applied to Filemon. Now it can be considered as the explanation to the file monitoring part of Procmon.]

How Filemon works?

  • Filemon installs a filesystem "filter driver".
  • First run of filemon requires "Load Driver" user right.
  • After the filter driver is loaded, filemon offers a level of security to prevent low-privilege user from manipulating the filemon driver.
  • Next, Filemon requires "Debug Programs" user right. This right allows the processes to debug any other process even if they are running in different accounts. Even though Filemon doesn't really require this right as it already has a driver to intercept all syscalls, Filemon checks if the user has the "Debug programs" right because the user will be able to see all the filesystem I/O events in Filemon even for the files they may not have access to. So Filemon checks for this right to make sure the user is privileged enough to get all that critical info. As administrators already have "debug programs" right by default, running filemon as administrator might be necessary.

Usage

We can pause/resume logging process by using Ctrl+E or using the capture icon in the toolbar.

We can clear all the logs and start from scratch using Ctrl+X or the icon in the toolbar.

We can search for any text thoughout all the columns using the search icon in the toolbar.

If we find anything interesting in the file activity and want to jump to that location in the explorer, we can right click on that entry and select Jump To to go to that location in the explorer.

History Depth option in (Options -> History Depth) can be useful if we're running ProcMon for a long period of time. ProcMon stores all the event data in the virtual memory. So running it for a long period of time can consume a lot of virtual memory or even cause ProcMon to raise an exception and crash because it ran out of memory. That's where History Depth option can be helpful. The default is 0 which means unlimited. Setting it to a fixed value will tell the Procmon to use only that much amount of memory and you can keep running it for however long you want.

We can add filters using the filter icon and even reset if we mess up anything and none of the events show up.

We can also set filters using the Filter options in the menu and set Highlighting feature as well. We also have an option to save the filter, import the previously exported filters etc.

Basic vs Advanced Mode

There is an option in Filters menu called Enable Advanced Output.

Things not seen in Basic mode:

  • Raw I/O request names (basic mode displays a user friendly name for a few parameters).
  • Internal filesystem ops
  • Activity in System process (including the ops performed by NTFS itself)
  • Procmon's own activity

Basically, Advanced mode has less Filters applied. You can see the change in the Filter list when you switch on the Advanced mode.

Using Regmon (or Registry monitoring part of Procmon)

Regmon is very similar to Filemon and it also creates a device driver to intercept Registry syscalls and checks for Debug Programs right of the user just like Filemon.

Note!!! The syscall hooking was done earlier before Windows XP. On Windows XP, Microsoft actually provides Registry IO interception hooks and Regmon uses that instead of syscall hooking. Mark discourages syscall hooking as it was being exploited by rootkits and various other types of malware. And Regmon was the first software to actually demonstrate syscall hooking in Windows and that led to all the bad guys taking advantage of this technique.

Starting Filemon/Regmon before Logon

If we want to capture file and registry logs even before logging in, we need to run Filemon and Regmon under the SYSTEM user. And because Filemon and Regmon don't belong to us, i.e., the current user, it keeps running before and after we login and logout respectively.

We can run Filemon and Regmon under the SYSTEM user using psexec (which is another Sysinternals tools).

The psexec command to do that is:

psexec -i -s <local path to filemon/regmon>

-i is to give filemon/regmon access to interactive desktop (for a GUI application and for us to see a window). -s is to run filemon/regmon under the SYSTEM account.

Running Filemon/Regmon as a Service to get traces from the Boot of the system

We need to run Filemon/Regmon as a service if we need to get traces right from the boot stage of the system.

We can actually do this by going to Options -> Enable Boot Logging. This will get us all the traces right from the beginning of the OS boot.

Enabling Boot logging will start procmon as a Boot Critical driver and captures boot traces.

Notes made from the video on Procmon by Sami Laiho

Source: https://www.youtube.com/watch?v=gVYZrUJdXqU&list=PL96F5PDvO1HHRbaGiDmcI0v92nb4yIcm3&index=5

We can view the Filter Driver installed by Procmon using the following command:

C:\Windows\system32>fltmc

Filter Name                     Num Instances    Altitude    Frame
------------------------------  -------------  ------------  -----
bindflt                                 1       409800         0
PROCMON24                               4       385200         0
WdFilter                                4       328010         0
storqosflt                              0       244000         0
wcifs                                   0       189900         0
CldFlt                                  1       180451         0
FileCrypt                               0       141100         0
luafv                                   1       135000         0
npsvctrig                               1        46000         0
Wof                                     3        40700         0
FileInfo                                4        40500         0

There might be cases where the traces might not reach the altitude of procmon filter driver. The syscall "packets" go from the highest altitude to the lowest altitude.

We can modify the altitude of the procmon driver in the Registry.

Sometimes, procmon can miss some traces from Defender or some security solution and in that case, we can higher or lower the value of the altitude in the Registry.

More on Filter Driver altitudes: https://docs.microsoft.com/en-us/windows-hardware/drivers/ifs/allocated-altitudes

Normally, filtering the logs will only filter them in GUI but all of the event logs will still be written to the page file and it keeps filling the memory.

To avoid filling up the memory and run procmon for a long time (like, for weeks), then we can choose Filter -> Drop Filtered Events option to truly drop events and only put the events that we are interested into the memory.

Wednesday, April 27, 2022

Windows Sysinternals Suite: "Process Explorer" tool

Process Explorer

(I created these notes while learning about Process Explorer tool.) 


Things to cover

  • Process List
  • Process Properties
  • Process control
  • Thread details
  • Handle view & DLL view

Introduction

Process Explorer is like a "Super Task Manager".

It has a lot of general troubleshooting capabilities:

  • DLL versioning problems
  • Handle memory leaks and locked files
  • Performance troubleshooting
  • Hung processes

What is a process?

A process is an instance of a running program.

3 main components of a process:

  • A private address space allocated to that particular process and is inaccessible by other process (so that other processes can't alter the data in the memory associated with this process)
  • Open handles such as files or registry keys that the process might be accessing.
  • Security token: username, the groups that the user is a member of, and the privilege list.

What is a thread?

Execution context within a process.

Threads run, not processes. A thread shares all the address space of the process, it shares the handle table and privileges. Every process starts with one thread.

Microsoft Task Manager

[The following description is outdated but is still informative. Video: https://www.youtube.com/watch?v=YGtsMa9wbjw] The 'Applications' tab shows the visible windows. Windows doesn't have any inherent concept of 'applications' or 'tasks' (it has the concept of task in terms of scheduled tasks that the user schedules in the scheduler) but it's all processes and threads.

The 'Status' column in Applications tab: 'Running' means waiting for the window messages (like user clicks, keyboard inputs etc.) 'Not responding' means it's doing something else in the background is currently not waiting for window messages or is not able to accept window messages.

Colors

Pink processes - service hosting processes. They are background tasks that run no matter who's logged in (generally).

Blue processes - processes running as me.

Cyan processes - the process is a Windows 8 application using the new APIs.

You can go to Options > Configure Color to see all sets of colors.

Process Controls

We can do the following on the Process in Process Explorer:

  1. Set Priority
  2. Kill Process (sends a kill signal to the process through the Win32 API). In the Options menu, we have Confirm Kill, which when unchecked, won't show us a dialog box to confirm whether we want to actually kill that process.
  3. Kill Process Tree: Kills the entire tree including the parent process and it's children. The exception of this rule is, if process A starts process B and process B starts process C, and process B exits, then doing Kill Process Tree on process A won't kill process C as C is already an orphan at this point and there is no connection between A and C.
  4. Restart: This option will kill the process and restart the process with the same command line switches that were used to start that process in the first place!
  5. Suspend: suspends the threads in a process. It doesn't kill them but just puts them on pause and it can be resumed later.

The pink processes host services. We can see the services hosted by them in the Services tab of Process Properties that shows up after double-clicking on them.


Accounting for CPU Usage

Windows OS has an interrupt every 15 ms to check what's running on the system at that current moment. That 15ms interval might change depending on the system. There is a sysinternals tool to check that. It's called clockres.exe.

Some threads run in these 15ms time interval and quickly enter the Wait state during this heartbeat by Windows OS. And in that way, they never appear in the radar of CPU usage even though they are using the CPU.

So sometimes, even though the CPU usage might appear 0%, the system might be very slow and that might be because of these kinds of threads that are going below the radar.

How to catch these threads?

Windows has something called as a Context Switch counter, which is an integer assigned by the Windows kernel to the thread. Whenever a thread wants CPU time, the kernel increments this Context Switch integer.

Process Explorer takes advantage of this by comparing the Context Switch difference at each clock tick (~15ms). This is called Context Switch Delta in Process Explorer and it can be added as a column in Process Explorer.

We can compare Context Switch Delta column and the CPU column. If CPU is 0% but Context Switch Delta is higher for any process, then that process is trying to get under the radar of being accounted for using the CPU time!


(Source of the above explanation: https://youtu.be/YGtsMa9wbjw?t=3448 i.e., at around 57:28 timeline).

There is a pseudo-process created by Mark Russinovich in Process Explorer called Interrupts. This is not a real process running on the OS but just added by the developer of ProcExp to the process list. The Context Switch Delta for this "process" is actually the number of times the interrupt has occurred and not the number of times the thread has run. It's just to get an idea of how many times the hardware interrupts are being called. By moving the mouse very swiftly, we can observe that the Context Switch Delta increases significantly.

To know which device drivers are causing the interrupt, we need some other tools and that info cannot be viewed in ProcExp. (Some tools mentioned in the video are kernrate. An API was added in Windows XP SP2 which also helps in keep track of the interrupts. But turning on the tracing features slows down the PC as the kernel needs to write every CPU interrupt to the memory. Some other tools for doing this are tracelog.exe and tracerpt.exe).

Multi-component Processes

Also, please note that if you want to view the parent-child tree in process explorer, you need to click on the 'show process tree' icon in the top toolbar.

We can view the function call stack of each thread in threads tab. We need to view that list from bottom to top. If a process has a lot of threads doing various things, then we can view what each thread is doing and how much CPU each thread is consuming and by viewing the call stack, we can get an idea about why that thread is consuming CPU. And we can try to suspend or kill that thread.


When we click on the 'Stack' button, we'll see the function call stack:

Hung Processes

Again, to get to know why the process has hung, we need to look at the thread call stack. We can also create a memory dump of the process by right-clicking on the process and creating the dump and opening the dump file in Windbg.

Open Files & Handles

We can view the handle table of the process by selecting a process and opening the lower pane (select the process and click on the lower pane icon in the top toolbar of the ProcExp).

This lower pane window shows all kinds of open objects related to that table like open files, open sockets, and various other Windows objects.


We can even select more columns in this lower pane!

We can also search for Handles from the search option in the toolbar (the binocular icon) and if something is found, and by double-clicking on that handle in the search result, it opens the corresponding entry in the lower pane.

Why examine open handles?

  • Solve file locked errors (for example, if you want to delete a file but you get an error saying a process has opened it. If you want to eject a flashdrive but get an error saying a process is using it etc. You can just search for the drive letter in ProcExp using binocular icon and get which process has opened which file on that flashdrive.)
  • Understand app resources like files, registry keys etc.

DLL View

To get the DLL View in the lower pane, click on View -> Lower Pane View -> DLL View

It shows more than just loaded DLLs. 


It includes .exe and any "memory mapped files" (i.e., files on the harddisk opened by processes and those are mapped to the memory for high speed access of the file content).

Malware Detection

Identifying potentially malicious processes:

  1. Check for company name and description
  2. Image path
  3. Verify signature (you can do that for all processes automatically by going to Options -> Verify Image Signatures)
  4. Look at the parent process.

Investigating unknown processes:

  1. Look at the Handle table for file or Registry Key handles
  2. Packed Images (exe files that are compressed or encrypted) (shows with purple color in ProcExp)
  3. Strings (can inspect strings in both the image and memory). (Here "image" is the exe file on disk). You can get the Strings in Process Properties (double-click on any process and you'll get that window).
  4. Look at the DLLs and you can also do a signature verification on the DLLs
  5. Look at the Autoruns sysinternals utility to find out the autoruns and if there are any malicious processes set to autorun on system startup or logon.

ProcExp doesn't tell us how the images have been configured to run on a system. A malware would like to have itself launched everytime we boot the system, logon to the system, launch certain applications etc. That's where we can use Autoruns.exe tool from sysinternals.

System Information

We can also view System information in ProcExp in View -> System Information option.

Image Hijack

When we select 'Replace Task Manager' in ProcExp (Options -> Replace Task Manager), ProcExp does something called as Image Hijacking where it edits the registry keys in such a way that whenever we wanna launch taskmgr.exe (i.e., the task manager exe), ProcExp executable will be launched.

We can view this info in Autoruns.exe in the Image Hijack tab to see what images have been hijacked.

Wednesday, March 2, 2022

Understanding DNS

(The diagrams in this article are created by Nandan Desai except for the ones that are credited to others.)

The Domain Name System was developed to organize and find the IP addresses of computers on a large distributed networks.

Before the domain name system was developed, the computer names and IP addresses were mapped in a simple text file called the hosts file. This file was maintained separately by each user on their own computer. So every computer had it's own version of the hosts file.

As the network size increased, the hosts file approach became impractical. To overcome the limitations of maintaining a hosts file, the Domain Name System (DNS) was developed.

DNS provides a way to organize the computer names and it's called the Domain Namespace or Domain Name Structure.

DNS also provides protocols, services and methods for storing, updating and retrieving the names and IP addresses for computers and it's called the DNS "system" .

From the perspective of the end user, we can consider the DNS as a structured hosts file.

(Point to be noted here: hosts file is still being used on many Operating Systems and the users can define the host names and IP addresses in that file for their own local use.)

The main criteria that were considered while developing the Domain Name System are:

  1. The system needs to be expandable.
  2. It needed to be distributed.
  3. It needed to be resilient. (If one server goes down, there had to be a backup server)
  4. It needed to have delegated authority.( An authority should be able to delegate authority to others in order to manage a massive pool of computer names.)

DNS system acts as a distributed database that resides on multiple servers which are configured to serve DNS requests. The job of these servers is to resolve computer names to IP addresses.

The process of translating user-friendly computer names into IP addresses is called a Resolution.
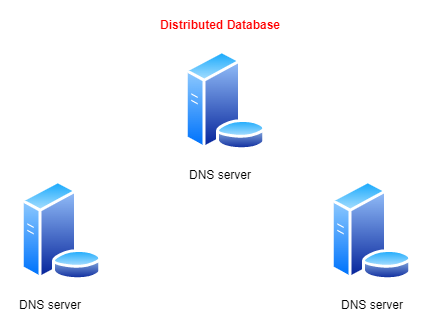
distributed database

Let's take an example of a PC (DNS client) looking for the IP address of a host name.

DNS clients run something called as a Resolver. This is an application usually built into the Operating System. And it's job is to query the DNS server. The Resolver sends a query to the DNS server to resolve a computer name/host name to an IP address. This is the most common type of DNS request and it's called as a Forward Lookup.

A 'Forward Lookup' resolves a computer name/host name to an IP address.
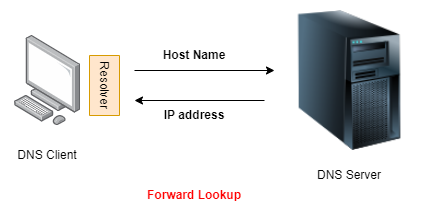
forward lookup

It's also possible to do a Reverse Lookup. A 'Reverse Lookup' does the exact opposite of the Forward Lookup query. It resolves an IP address to a host name. A DNS Server needs to be configured to allow Reverse Lookups. It is not configured by default.
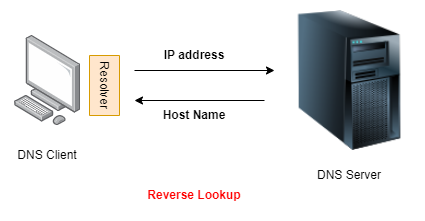
reverse lookup

Both of these examples of lookup queries are very simplified. Before we take a closer look at how the DNS Resolution works, we need to talk about the Domain Namespace.

Domain Namespace (also known as Domain Name Structure)

The Domain Namespace (or Domain Name Structure) is a naming scheme that is organized into a tree-like hierarchy. Let's take a look at the example cred.club. (https://cred.club). This is called as a Fully Qualified Domain Name (FQDN). A Fully Qualified Domain Name gives the exact location within the tree structure. Each level in the domain tree structure is separated by a period (.). It's very similar to specifying a path to a file in a file system. But the important thing to know here is, the domain names are resolved from right to left.

Let's take a look at the cred.club. domain name again. The full stop(.) after the .club refers to the root domain. Root domain is at the very top of the tree and it is represented by a (.). It is at the highest level of the domain hierarchy. This final full stop(.) isn't something we need to type when we enter a domain name into our web browser. It's being taken care for us but we can type it if we wish and it's perfectly fine.

After the root domain, we have the Top Level Domains. This level in the hierarchy indicates the type of organization the domain name belongs to. For example, .org belongs to an organization, .gov belongs to the government, .mil belongs to the military, .com is commercial and .club belongs to a club. Top Level Domains may also be based on geographical location as well. For example, .in for India, .ca for Canada, .co.uk for the UK etc.
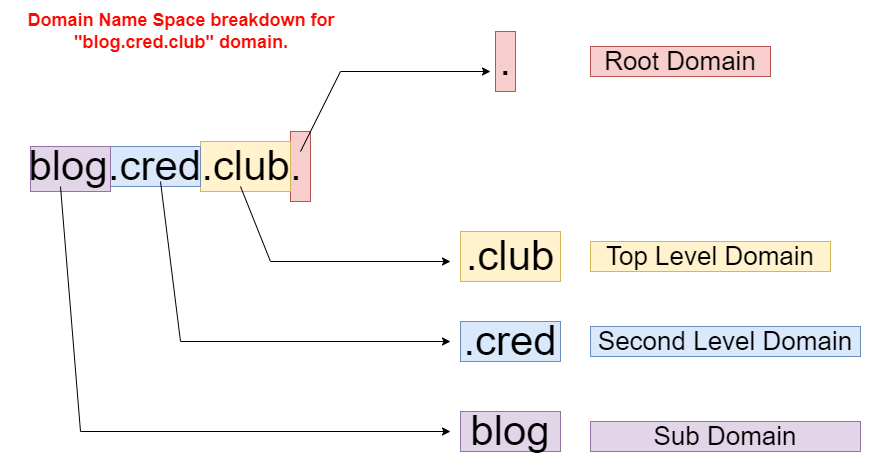
domain name space

After the Top Level Domains, we have the Second Level Domains, which are registered for individuals or various organizations. In our example, .cred belongs to the company called CRED.

After Second Level Domains, we have Sub Domains. For example, blog.cred.club. has blog as the Sub Domain of cred.club..

After the Sub Domains, we can have Hosts. For example, host1.blog.cred.club can be a Fully Qualified Domain Name for a server hosting the blog. Of course, that's not a real domain name but it's possible for CRED to have a server hosting a blog with that host name.
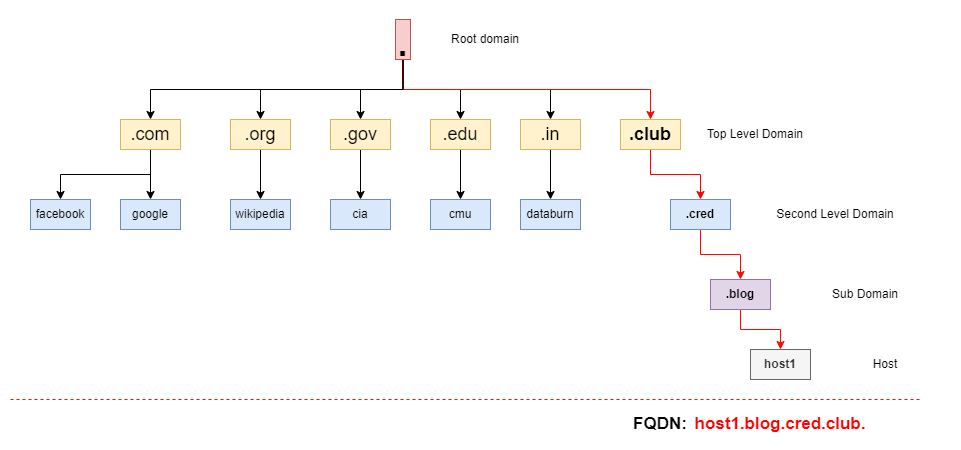
Domain-namespace

It's important to understand how a Fully Qualified Domain Name is structured because this same hierarchy is used by DNS to resolve a Fully Qualified Domain Name.

Domain Name Resolution Process

When a web browser wants to get the IP address of a domain name, it asks the Resolver service of the Operating System.

The resolver service first checks the hosts file on the local file system of the client. All the local hostnames (including the "localhost" to "127.0.0.1" translation) are mentioned in this file.

If the resolver doesn't find the translation in this file, it checks it's local cache. If there are no entries related to the request in the resolver's cache, it goes to the DNS server of the local network (or whichever DNS server is mentioned in the Resolver service's configuration. This can be a local DNS server, Google's 8.8.8.8 server, Cloudflare's 1.1.1.1 etc.). The local DNS server (or the 8.8.8.8 server) checks if it has any entries related to the request in it's cache. If not, then it goes to the Root name servers!

Root name servers keep a record of all Top Level Domain (TLD) nameservers. And they respond to the local DNS server with a list of nameservers who have authority over that Top Level Domain.

Before we move further, we need to be aware of a few definitions here.

Nameserver: A server having a database (not cache, but a database) of DNS records is called a Nameserver. These records are called Resource Records (RRs). Authoritative Nameserver: A nameserver which can respond to the query on it's own from it's own records (not cached records, but DNS database records) is called as an Authoritative Nameserver. If it's able to respond from it's own database records, then that means it has authority over that domain.

After receiving a list of TLD nameservers from the root nameserver, the local DNS server makes a request to the TLD nameserver regarding it's query for the IP address of a domain name.

If the TLD nameservers have the answer, they respond with the IP address. Or else, they will respond with another list of Second Level Domain nameservers. The local DNS server can finally ask these Second Level Domain nameservers for it's request.

If the Second Level Domain nameservers have the authority over the queried domain name, then they will respond with the IP address, or they will again "redirect" the local DNS server to other nameservers who have the authority over the requested domain name.

The diagram below shows how the resolution works if we want to visit cred.club domain name.
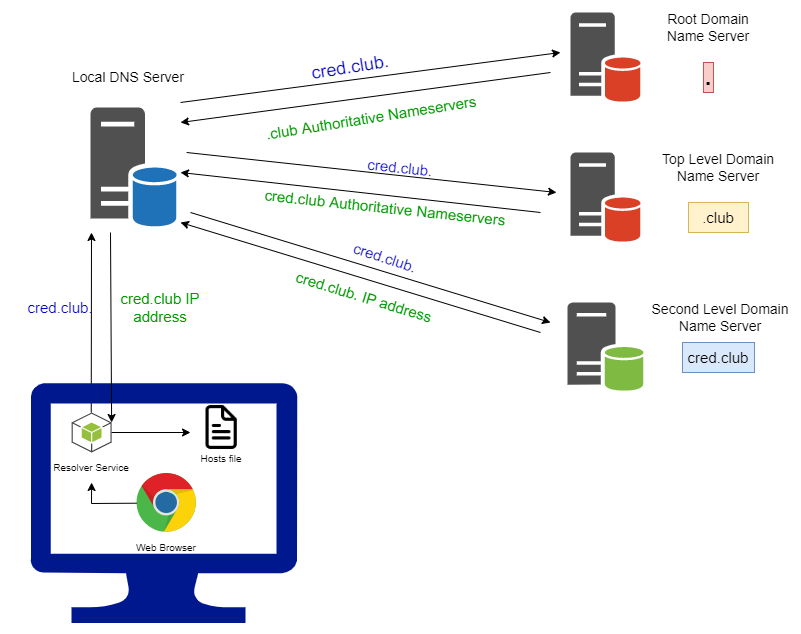
dns resolution process

In the above example, the root nameserver responds with the nameservers who have authority over .club Top Level Domain.

The TLD nameservers respond with Authoritative nameservers for cred.club.

The cred.club Authoritative nameservers finally respond with the IP address for the cred.club domain.

The local DNS server responds back the the Operating System's Resolver service with the IP address of cred.club and then the browser can send whatever packets (HTTP requests) it wants to that IP address!

It's as if the local DNS server is traversing a tree data structure from top to bottom (from root nameserver to the cred.club authoritative nameserver).

That's how the DNS resolution works!

In our example, the local DNS server was making DNS requests on behalf of the Resolver service. This type of query is called as a Recursive query of the local DNS server. Here the local DNS server is not making DNS requests for itself but it's doing it for the Resolver service. Hence it's making a Recursive query. The servers making such recursive DNS queries are sometimes referred to as recursive DNS servers. Google's 8.8.8.8 Public DNS server and Cloudflare's 1.1.1.1 Public DNS servers are all recursive DNS servers. When we issue a DNS query to these servers and if they don't know the answer, they query root nameservers, TLD nameservers etc. on our behalf and simply give us the IP address at the end.

There are two switches within the DNS message header called RD (Recursion Desired) and RA (Recursion Available). When we send a DNS message to a DNS server with RD bit set, then we're indicating to the server to just give us the IP address directly by doing a recursive query to other DNS servers as required. If that DNS server supports recursive queries, then it does all the other requests on our behalf and gives us the IP address at the end. And the response packet will have RA bit set, which means, the server is telling us that the recursion feature is available on that server and it just made a few recursive requests to get us the IP address for the domain name we had requested.

If the Resolver service makes the DNS requests to the root nameservers directly and "walks down the tree" on its own, then that will be an Iterative query.

DNS Message Structure

The DNS protocol uses a common message format for all exchanges between client and server or between the servers.

IdentificationControl
Question countAnswer count
Authority countAdditional count
Question
...
Answer
...
Authority
...
Additional
...

The Identification field contains a random integer to match up requests and responses.

The Control field contains the aforementioned RD and RA bits amongst other info. It also contains OpCode to indicate what's the purpose of the request. That is, whether this DNS message is for a query, or to check status of the DNS server etc.

The Question, Answer fields contain incomplete Resource Records in the following format: {NAME, TYPE, CLASS}. The Question field contains the domain name that is being requested by the DNS client. Answer field will contain the IP address that the DNS server has found for the requested domain name.

Authority and Additional fields contain the complete Resource Records in the following format: {NAME, TYPE, CLASS, TTL, (RDATA_LENGTH), RDATA}. If the DNS server doesn't know the IP address of the domain name requested by a client but knows who has the authority of the next level down the Domain namespace tree, then that authority name will be included in the Authority field. And if that DNS server also knows the IP address of that authority, then that will be included in the Additional field.

We'll cover more on Resource Records in the following section.

DNS Zones

We know that the Domain Namespace is a hierarchical tree, with the DNS root domain at the top. A DNS zone is a portion of the DNS namespace that is managed by a specific organization or an administrator. A DNS zone starts at a domain within the tree and can also extend down into subdomains so that multiple subdomains can be managed by one entity.

Imagine a hypothetical zone for the cloudflare.com domain and three of its subdomains: support.cloudflare.com, community.cloudflare.com, and blog.cloudflare.com. Suppose the blog is a robust, independent site that needs separate administration, but the support and community pages are more closely associated with cloudflare.com and can be managed in the same zone as the primary domain. In this case, cloudflare.com as well as the support and community sites would all be in one zone, while blog.cloudflare.com would exist in its own zone.
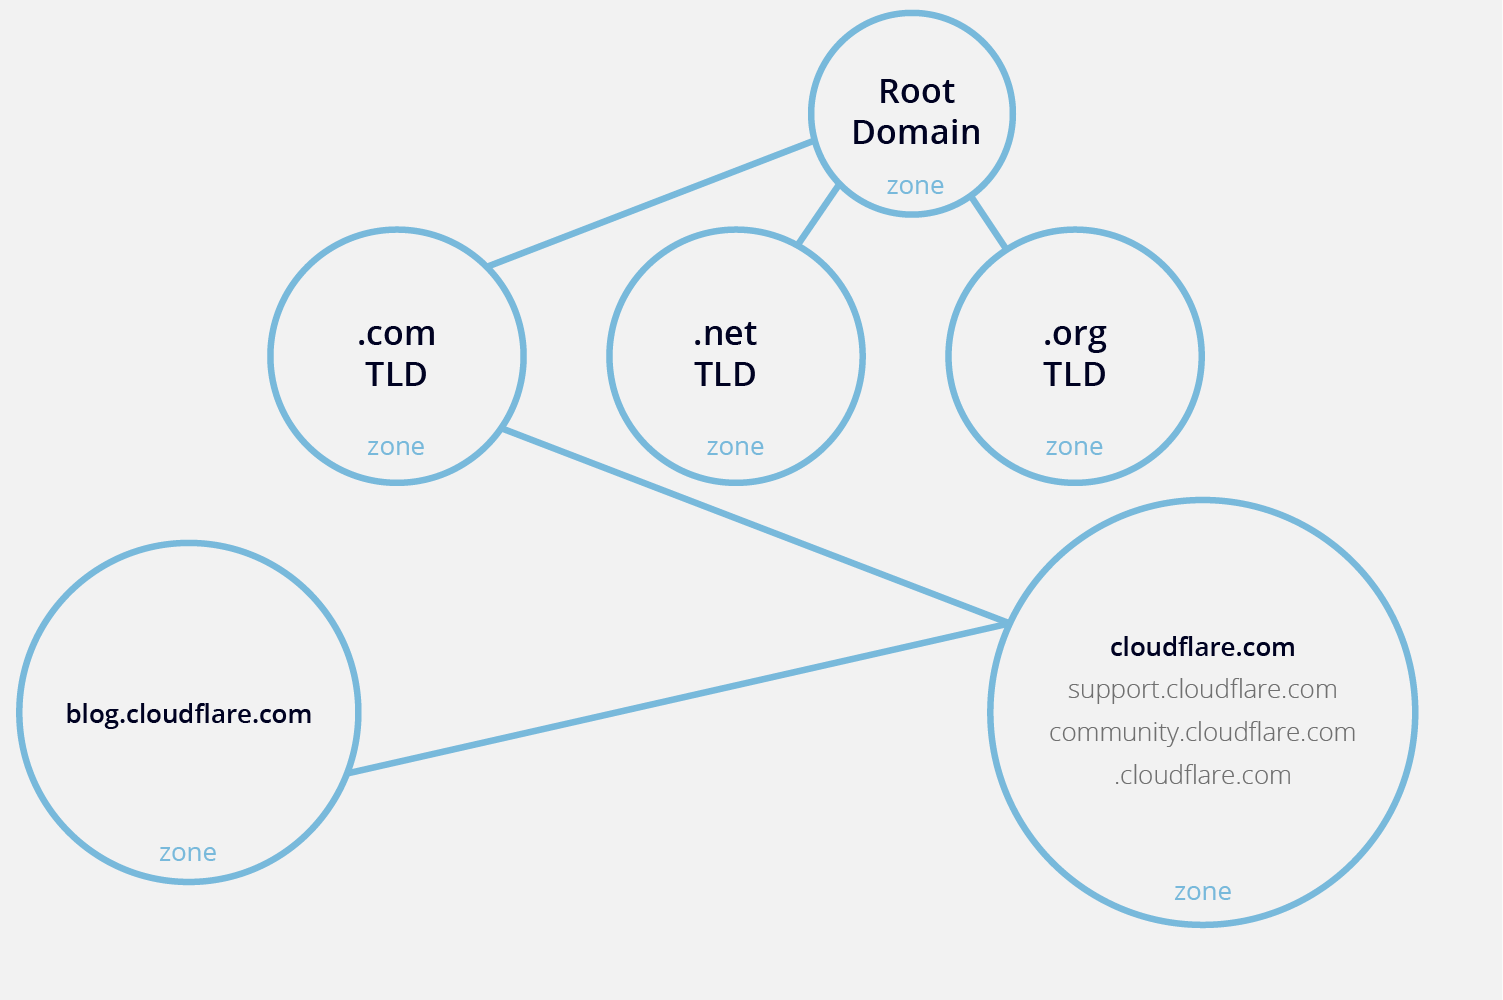
cloudflare

(the above diagram is taken from here).

A DNS zone is defined by a Zone file. It is a plain text file that contains all the information about the zone. This information in the Zone file are called Resource Records (RRs). And this file lives on the Authoritative nameserver and the Authoritative nameserver has the authority over that zone. Authoritative nameserver is considered as the "zone apex", i.e., it lives at the top of the "zone tree".

A sample Zone file for example.com is shown below: (The character ; is for comments)

$ORIGIN example.com.
$TTL 86400
@    SOA    dns1.example.com.    hostmaster.example.com. (
        2001062501 ; serial
        21600      ; refresh after 6 hours
        3600       ; retry after 1 hour
        604800     ; expire after 1 week
        86400 )    ; minimum TTL of 1 day
;
;
    NS    dns1.example.com.
    NS    dns2.example.com.
dns1    A    10.0.1.1
    AAAA    aaaa:bbbb::1
dns2    A    10.0.1.2
    AAAA    aaaa:bbbb::2
;
;
@    MX    10    mail.example.com.
    MX    20    mail2.example.com.
mail    A    10.0.1.5
    AAAA    aaaa:bbbb::5
mail2    A    10.0.1.6
    AAAA    aaaa:bbbb::6
;
;
; This sample zone file illustrates sharing the same IP addresses for multiple services:
;
services    A    10.0.1.10
        AAAA    aaaa:bbbb::10
        A    10.0.1.11
        AAAA    aaaa:bbbb::11

ftp    CNAME    services.example.com.
www    CNAME    services.example.com.
;
;

In the above Zone file, we can see that there are different types of Resource Records, namely, SOA, NS, A, AAAA, MX, and CNAME.

Zone files must always start with a Start of Authority (SOA) record, which contains important information including the primary nameserver, the email of the domain administrator, the domain serial number, and several timers relating to refreshing the zone.

We also have Name Service (NS) records which give the names of Nameservers, Address (A for IPv4 and AAAA for IPv6) records (this is the most commonly requested record by most internet users) contains the IP address of a domain name, Mail Exchange (MX) gives the name of the mail server, Canonical Name (CNAME) record returns the alternate name of the requested domain name (the client making this request will have to make a new request with the new name returned in CNAME record).

In the above example, dns1.example.com. is the Authoritative nameserver of this zone (as mentioned in the SOA record) and it has services.example.com, ftp.example.com, www.example.com Sub Domains under it.

ftp.example.com and www.example.com are just aliases for services.example.com (as mentioned in the CNAME record) and services.example.com has an A record with IP address of 10.0.1.10.

So, if a user wants to visit ftp.example.com, then the flow of DNS requests will be as follows: ftp.example.com -> services.example.com -> 10.0.1.10 and the user will get 10.0.1.10 as the IP address for ftp.example.com.

Tip: If you own a domain name on GoDaddy, you can view your Zone file in the GoDaddy UI by going through the following options in the menu: DNS -> Manage Zones -> (search your domain name in the UI and click on it) -> (scroll down to the bottom of the page) -> Export Zone File .
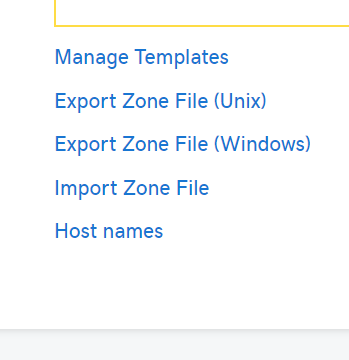
GoDaddy Interface

Zone Transfer

Usually, there are multiple Nameservers for a domain. And amongst them, there is one Primary nameserver and the rest will be Secondary nameservers. In our previous example, dns1.example.com was the Primary nameserver as it was mentioned in the SOA record and dns2.example.com is the Secondary nameserver (it was mentioned in the NS record).

If any changes are made to the Zone file of the Primary nameserver, then that has to be reflected on the Secondary nameserver. So, upon such changes to the Zone file on the Primary nameserver, the Primary notifies this to the Secondary and asks it to initiate something called as a Zone Transfer request. It's basically the Secondary nameserver asking for a copy of the Zone file from the Primary nameserver.

To request for a Zone Transfer, the Secondary nameserver needs to send a special DNS query called AXFR query to the Primary nameserver.

In an AXFR query message, the OpCode field in the DNS message header will be set to 0 and the TYPE field in Question section of DNS message is set to 252 to indicate that it's an AXFR request. Apart from these, the AXFR request must be sent on TCP packets. Normal DNS messages work on UDP (although they can be configured to work on TCP, TLS, HTTPS etc. as well). But AXFR query, which is specially used for Zone Transfers, must be made on reliable protocols like TCP.

Sometimes, the Primary nameservers are misconfigured and respond to any AXFR queries made by any public clients and they just send the whole Zone file to the clients. This is termed as "DNS Zone Transfer Attack". A Zone file of any Nameserver can be very valuable to the attackers as it contains information about the whole network topology of the entire Zone.

AXFR query to get the Zone file of wikipedia.org:

nandan@nandan:~$ dig @ns1.wikimedia.org. -t AXFR wikipedia.org
; <<>> DiG 9.16.1-Ubuntu <<>> @ns1.wikimedia.org. -t AXFR wikipedia.org
; (1 server found)
;; global options: +cmd
; Transfer failed.

Although the above query failed, we can try our luck during a pentest to watch for misconfigured Authoritative nameservers.

Here's how a successful Zone transfer would look like:

> dig @ns2.eppi.com -t AXFR cpsr.org
; <<>> DiG 9.5.0b1 <<>> @ns2.eppi.com -t AXFR cpsr.org

cpsr.org             10800   IN      SOA   ns1.findpage.com. root.cpsr.org.
cpsr.org.            10800   IN      NS    ns.stimpy.net.
cpsr.org.            10800   IN      NS    ns1.findpage.com.
cpsr.org.            10800   IN      NS    ns2.eppi.com.
cpsr.org.            10800   IN      A     208.96.55.202
cpsr.org.            10800   IN      MX    0 smtp.electricembers.net.
diac.cpsr.org.       10800   IN      A     64.147.163.10
groups.cpsr.org.     10800   IN      NS    ns1.electricembers.net.
localhost.cpsr.org.  10800   IN      A     127.0.0.1
mail.cpsr.org.       10800   IN      A     209.209.81.73
peru.cpsr.org.       10800   IN      A     208.96.55.202
www.peru.cpsr.org.   10800   IN      A     208.96.55.202
[...]

The above query doesn't work now, but that example is taken from Nmap book.

Further learning

  • How are public domain names created and where are they registered?
  • Why can't 2 people register the same domain name? There has to be a universal domain registry database with all the public domain names stored in it and which ensures that there are no duplicate public domain names. Who owns and manages this universal public registry?
  • Where can I create a public domain name for myself? For that, I need to visit a Registrar to register my domain name and I will be charged some money for it. But a Domain Registrar is a private company. Who gave this private company the authority to register a public domain name?
  • How can I become the Registrar myself!?!?!
  • What is WHOIS protocol?

GoDaddy, a domain registrar, has a YouTube video that answers some of our questions!

References

https://www.youtube.com/watch?v=4a3MGDAoljI

https://www.youtube.com/watch?v=JDc9IZVFLm0

https://www.cloudflare.com/en-in/learning/dns/glossary/dns-zone/

https://www.youtube.com/watch?v=833Qnc-7-ug

https://beaglesecurity.com/blog/vulnerability/dns-zone-transfer.html

https://sushant747.gitbooks.io/total-oscp-guide/content/dns_zone_transfer_attack.html

http://www-inf.int-evry.fr/~hennequi/CoursDNS/NOTES-COURS_eng/msg.html

https://www.cloudflare.com/en-in/learning/dns/dns-records/

https://docs.fedoraproject.org/en-US/Fedora/12/html/Deployment_Guide/s2-bind-zone-examples.html

Sunday, February 20, 2022

Understanding Physical and Virtual Memory

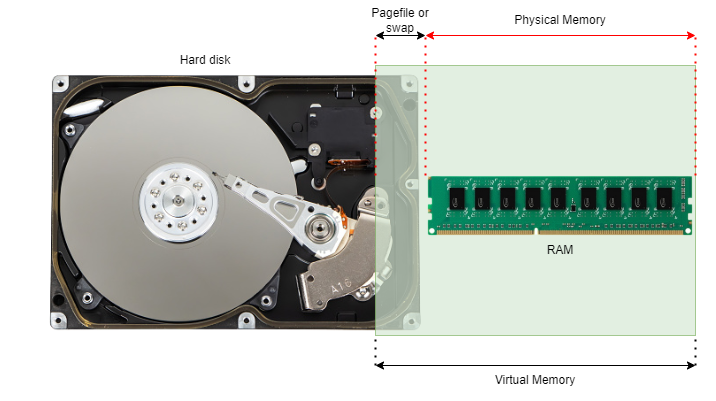
Image created by Nandan Desai

(The above image is created by Nandan Desai

In modern operating systems, applications always reference memory using virtual memory addresses. The above diagram illustrates what a Virtual Memory is! Virtual Memory is just a layer on top of RAM and some small portion of hard disk (known as pagefile or swap). Applications are only aware of the Virtual Memory and are not aware of the pagefile or the physical memory.

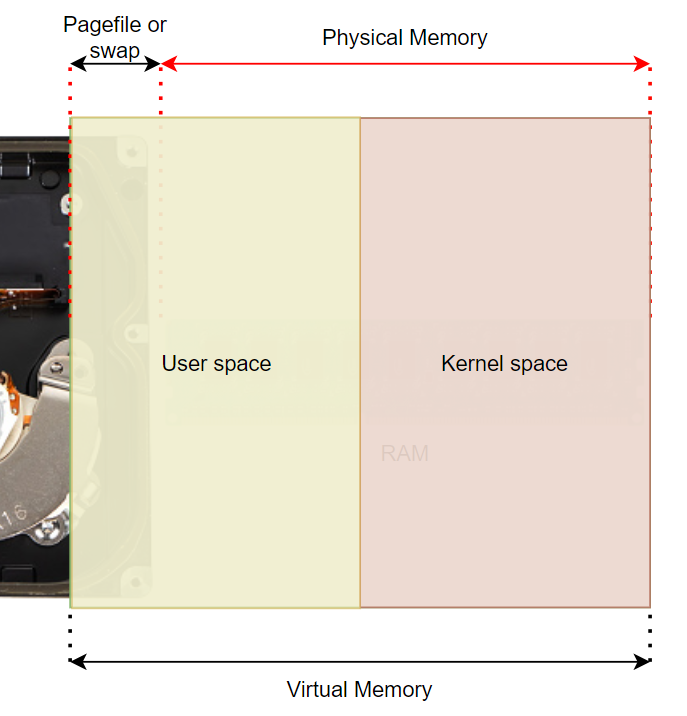
This Virtual Memory is divided into two parts.

  • User-mode virtual address space ("user space")
  • Kernel-mode virtual address space ("kernel space")

Image created by Nandan Desai

 (The above image is created by Nandan Desai)

The kernel and certain device drivers, which typically run in the privileged mode (a.k.a, kernel mode) of the processor, take up the Kernel-mode virtual address space. The rest of the processes, which typically run in user mode of the processor, take up the User-mode virtual address space.

The processes running in the kernel mode of the processor can access both user space and kernel space of the virtual memory.

Processes running in the user mode of the processor can only access the user space assigned to them.

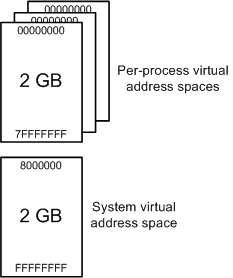
On a 32-bit Windows machine, and with default configurations, the user space is 2GB and kernel space is 2GB. Each virtual address length is 32 bits and therefore, there are a total of 2^32 virtual addresses which can address a total virtual memory of 4 GB. Usually, the first half of the virtual addresses (0x00000000 to 0x7FFFFFFF) are for user space, and the next half (0x80000000 to 0xFFFFFFFF) are for the kernel space.

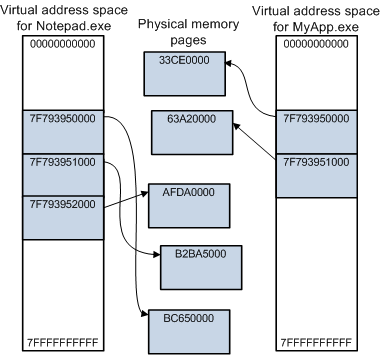
A peculiar difference between user space and kernel space is, the entire user space is private for each process! That means, when a process is loaded into the virtual memory, it sees that the entire user space (i.e., the address from 0x00000000 to 0x7FFFFFFF) is free for it to use! It can take up any address from the user space and it doesn't affect the other processes! This is the illusion that the Memory Manager of the Operating System creates for every user-mode process on the system! Every process thinks that it is free to take up any of the addresses in the range 0x00000000 to 0x7FFFFFFF. And that's why, two or more processes can have the same virtual address. But the physical address will obviously differ. We'll talk about how this mapping from virtual memory to physical memory is done later!

But as for the kernel space is concerned, it's shared amongst all the kernel-mode processes. If the kernel space ranges from the address 0x80000000 to 0xFFFFFFFF (as it is for the 32-bit Windows), then two kernel mode processes cannot have the same address in that range or otherwise, they will be overwriting each other.

The following diagram illustrates this clearly:

Image taken from Microsoft Docs

(The above image is taken from Microsoft Docs)

On 64bit Windows, user-mode and kernel-mode virtual address space is 128 TB each!

It's that huge because the total addressable size for a 64-bit machine is 2^64 bits (~2.305 Exabytes).

That means, each user mode process can take up any address between 0x000'00000000 to 0x7FFF'FFFFFFFF.

More on this Windows memory limits here: https://docs.microsoft.com/en-us/windows/win32/memory/memory-limits-for-windows-releases#memory-and-address-space-limits

Now, of course the user-mode or kernel-mode processes cannot consume 128 TB of memory because of hardware limitations. But the Memory Manager creates this illusion for the processes that they can use that much amount of memory addresses. That's why the memory that the processes see is called a Virtual Memory. Because it's not real!

So, to conclude, here is an illustration of how Notepad.exe and MyApp.exe's virtual memory layout may look like and how they are mapped to the Physical memory (and notice the virtual addresses and physical addresses of the two processes).

Image taken from Microsoft Docs

(The above image is taken from Microsoft Docs) 

Memory Management Internals

Today's modern systems use Paged Memory Management technique to manage the physical memory efficiently.

The physical memory is divided into contiguous blocks of fixed length called frames. And the virtual memory is divided into a contiguous blocks (of the same size as frames) called pages. Usually, pages and frames are 4KB in size. This size depends on the instruction set architecture and the processor type. The operating system selects one or more sizes from the page sizes supported by the architecture. The page sizes can vary from 4KB to sometimes 2MB or 4MB or even 1GB!

When a program is executed, it is loaded into the virtual memory (and has it's own virtual address space if it's a user-mode process, as explained earlier). As the program grabs pages of the virtual memory, these pages are mapped to the frames of the physical memory. This mapping is done by the Memory Manager of the Operating System.

The ultimate goal of a Memory Manager is to satisfy the memory requirements of all the processes running on the system. It does this by constantly moving frames from physical memory to the pagefile (on the disk) and vice versa. The processes are not aware of this and are in the illusion that they are just using pages of "memory" as required but behind the scenes, the Memory Manager keeps hustling and gives an impression to the processes that they are using the lightning-fast memory but, in reality, they might just have some of their pages residing on the disk! The moving of frames from physical memory to the pagefile is called Memory Paging or Swapping. Each Operating System (whether it's Windows or Linux or any other OS) has it's own algorithm of how the Memory Manager is implemented. But the overall concept of Memory Management remains the same across Operating Systems.

Page Table

The Memory Manager maintains a table where it stores the mapping-related data of pages and frames. This table is called as a Page table and each of the mapping entry in that table is called a Page Table Entry (PTE). Page table resides separately on the Physical Memory and the table content is directly managed by the Memory Manager of the OS.

Virtual address translation

Even the processor of the system sees the virtual address when it's executing an instruction of a process. If a process wants to read/write data on the "memory", the process specifies that to the processor through an instruction and the virtual address where that data has to be read/written.

When the processor goes to execute that instruction and tries to visit that virtual address, there is a special hardware component called Memory Management Unit (MMU) which intercepts this virtual address on-the-fly and replaces it with corresponding the physical address!

MMU refers to the Page table in the memory to do this virtual address translation. Remember that this Page table was created and is maintained by the Memory Manager of the Operating System. MMU only refers that page table to do the virtual address translation for the processor.

As the MMU has to go through the Page table every time it has to do the virtual address translation, there is another hardware component within the MMU called Translation Lookaside Buffer (TLB) which helps in speeding up this translation process.

TLB is just a small memory cache to store a few previously translated virtual address and their corresponding physical addresses. This cache is present only to speed up the translation process in the MMU.

So, here is how the entire virtual address translation process flows:

  1. When a virtual address needs to be translated to a physical address, TLB is searched first.
  2. If a match is found, which is known as a TLB hit, the physical address is returned and memory access can continue.
  3. However, if there is no match, which is called a TLB miss, the MMU (or, in certain implementations, the operating system's TLB miss handler) will typically look up the address mapping in the page table to see whether a mapping exists, which is called a page walk.
  4. If a mapping exists in the page table, it is written back to the TLB, and the faulting instruction is restarted. And now the MMU will obviously find the mapping in TLB and the process carries on normally.
  5. If a mapping exists in the page table, but the Page Table Entry (PTE) is marked as "moved out" (i.e., the frame corresponding to the page has been moved out of the physical memory and to the disk), then the MMU raises a Page fault exception. This page fault exception will be handled by the Memory Manager of the Operating system. The Memory Manager needs to bring back that frame to the Physical memory, update the Page table, and then restart the instruction that had a Page fault.
  6. If the mapping does not exist in the Page table, then the MMU will call the Operating System to handle this case. The OS will send a Segmentation Fault signal to the offending program which usually leads to a program crash.

Page table implementations differ on different systems. Some systems used to maintain a single global Page table while some others maintain a Page table for each process. There are also some implementations where the Page tables are stored in Virtual Memory. That means, the Page tables need to be paged themselves. And we also have hierarchical page tables. The complexities increase as we go deeper into the implementation details of various systems. But the concept of memory management described in these notes remains the same.

It's important to note that the Paging needs to be enabled by the kernel during the system boot process. On Intel processors, Paging is enabled by setting the PG flag of a control register named cr0. When PG = 0, virtual addresses are interpreted as physical addresses.

The Memory Manager initializes the Page Table in the Physical memory and then enables Paging by setting the PG flag of cr0 control register. From that point onwards, MMU starts considering all addresses as virtual addresses and does the translation as described previously.

Direct Memory Access (DMA)

There are certain peripherals (such as Thunderbolt ports) on some PCs that allow the devices to access the Physical memory directly. The data from these devices doesn't flow through the CPU. And the MMU doesn't touch these DMA instructions. DMA devices can directly work with the Physical memory to speed up the data transfer. But how much or what part of Physical memory is allowed to be accessed by such devices depends on the system architecture. This direct access to the Physical memory is called Direct Memory Access (DMA). There were/are certain vulnerabilities in DMA and are exploited by the attackers to bypass OS security checks and gain access to part or whole of the Physical Memory and steal data or install a malware on the Physical memory. Such attacks are called "DMA attacks".


References:

https://static.lwn.net/images/pdf/LDD3/ch15.pdf

https://doc.lagout.org/operating%20system%20/linux/Understanding%20Linux%20Kernel.pdf

https://tldp.org/LDP/tlk/mm/memory.html

https://www.kernel.org/doc/html/latest/admin-guide/mm/concepts.html

https://en.wikipedia.org/wiki/Memory_management_unit

https://techcommunity.microsoft.com/t5/ask-the-performance-team/pages-and-page-tables-8211-an-overview/ba-p/373113

https://techcommunity.microsoft.com/t5/ask-the-performance-team/memory-management-101/ba-p/372316

https://www.cs.cornell.edu/courses/cs4410/2015su/lectures/lec14-pagetables.html